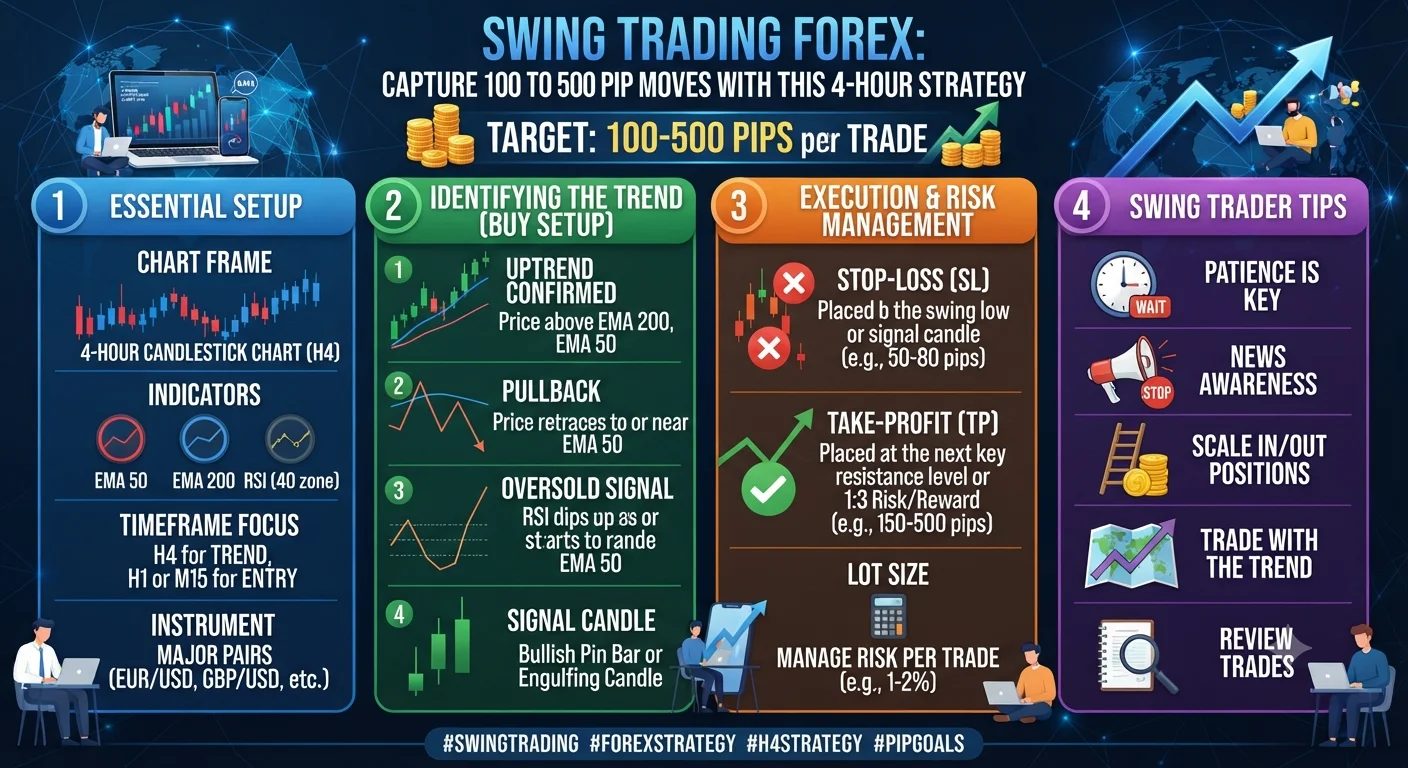
Forex swing trading is a medium-term strategy where traders hold positions for two to seven days, targeting moves of 100 to 500 pips by capturing a single directional swing within a larger trend. The 4-hour chart is the preferred timeframe for swing trading in 2026 because it filters out intraday noise while still generating enough signals to keep a trader consistently active. Using EMA crossovers, swing point analysis, and a minimum 1:2 risk-reward ratio, swing traders can achieve consistent profitability while spending only 30 to 60 minutes per day on chart analysis.
What Is Swing Trading and How Does It Differ from Scalping?
Swing trading sits in the middle of the trading style spectrum. At one end, scalpers hold positions for seconds to minutes and target 5 to 15 pips. At the other end, position traders hold for weeks or months targeting hundreds to thousands of pips. Swing traders occupy the middle ground, holding trades for two to seven days and targeting single directional price swings of 100 to 500 pips.
This positioning gives swing trading a meaningful practical advantage: it does not require constant screen monitoring. A swing trader using the 4-hour chart needs to check their charts only two to four times per day, typically at the open of key trading sessions. Orders are placed with a stop loss and take profit attached, meaning the trade manages itself between check-ins. This makes swing trading the most compatible style with a full-time job or other significant time commitments.
Compared to scalping, swing trading has a lower trade frequency but higher pip targets per trade. Where a scalper might take 15 trades per day at 10-pip targets, a swing trader might take 8 to 12 trades per month at 150 to 300-pip targets. The math of risk and reward is essentially similar, but the psychological experience is very different. Swing trading requires patience to wait for setup completion and the conviction to hold a position through temporary retracements without being stopped out prematurely or exiting early out of anxiety.
The 4-Hour Timeframe: Why Institutional Traders Prefer It
- What Is Swing Trading and How Does It Differ from Scalping?
- The 4-Hour Timeframe: Why Institutional Traders Prefer It
- Identifying Swing Highs, Lows, and Trend Direction
- How to Use the EMA Crossover for Swing Trade Entries
- Risk-Reward Ratios for Swing Trading: Targeting 1:2 and Beyond
- Building a Weekly Swing Trading Routine in 2026
- Key Takeaways for Swing Traders in 2026
The 4-hour chart has earned a near-universal endorsement among professional traders as the primary timeframe for swing trading analysis, and the reasons are well-grounded in market structure.
Each 4-hour candle represents four hours of genuine order flow and price discovery. This means false breaks, stop hunts, and random intraday noise that pollute the 15-minute and 1-hour charts are substantially filtered out. Key levels drawn on the 4-hour chart, including support and resistance, swing highs and lows, and EMA positions, are respected by institutional algorithms and human traders alike because they represent meaningful market consensus rather than short-term noise.
Institutional desks at major banks including JPMorgan, Goldman Sachs, and Deutsche Bank have been documented in academic market microstructure research to use daily and 4-hour timeframes as primary reference frames for their directional trading decisions. When retail traders align their analysis with these timeframes, they are effectively trading in the same structural framework that the largest participants use, improving the probability that key levels will be respected.
In 2026, with algorithmic trading representing approximately 70 to 75% of daily forex volume according to estimates from the Bank for International Settlements, the 4-hour chart holds additional significance because many institutional algorithms are calibrated to identify and trade key price levels on this timeframe.
Identifying Swing Highs, Lows, and Trend Direction
Before any EMA or indicator is applied to the chart, the foundation of swing trading must be established through pure price structure analysis. A swing high is a candle (or cluster of candles) where price reaches a peak and is flanked on both sides by lower highs, creating a visible local maximum. A swing low is the opposite: a trough flanked by higher lows on both sides, creating a visible local minimum.
These swing points define the trend. In an uptrend, the market creates a sequence of higher swing highs and higher swing lows. Each new high exceeds the previous high, and each pullback terminates at a level above the previous pullback low. In a downtrend, the market creates lower swing highs and lower swing lows. Price discovery is moving progressively lower with each swing.
Understanding which trend phase the market is in determines which direction swing trades should be taken. In an uptrend, only long (buy) swing trades are valid, entered on pullbacks toward swing lows and anticipated to run toward new swing highs. In a downtrend, only short (sell) swing trades are taken, entered on rallies toward swing highs in anticipation of continuation lower.
On the 4-hour EUR/USD chart as of mid-2026, swing points are clearly spaced, often 80 to 200 pips apart, providing ample room for trades that target 150 to 400 pips with stops of 50 to 80 pips. This creates natural risk-reward opportunities of 1:2 to 1:5 on well-structured setups.
How to Use the EMA Crossover for Swing Trade Entries
The EMA crossover is one of the most widely used entry triggers in swing trading because it provides an objective, rule-based signal that requires no discretionary interpretation. For the 4-hour swing trading system, two EMAs are applied to the chart:
The 21-period EMA represents the short-term trend and reacts quickly to price changes. The 50-period EMA represents the medium-term trend and changes direction more slowly.
Recommended Articles
 TRADING STRATEGIES
 TRADING STRATEGIES
 TRADING STRATEGIES
 TRADING STRATEGIES
Bullish crossover signal: When the 21-period EMA crosses above the 50-period EMA from below, and both EMAs are sloping upward, a bullish swing trade setup is active. This does not mean entering immediately at the crossover. Instead, the crossover confirms the trend direction, and the trader waits for a pullback toward the 21-period or 50-period EMA before entering long.
Bearish crossover signal: When the 21-period EMA crosses below the 50-period EMA, and both EMAs are sloping downward, the bearish swing trade framework is active. Short entries are taken when price rallies back toward the 21-period EMA and begins to show reversal signals such as a bearish engulfing or shooting star candlestick.
Entry refinement: A raw EMA crossover entry at the point of the cross is less effective than waiting for the first pullback following the cross. This pullback entry accomplishes three things. It provides a lower entry price on long trades and a higher entry price on short trades, improving risk-reward. It confirms that the market has accepted the new trend direction through a failed attempt to reverse. And it places the stop loss behind a well-defined structural level (the swing low that formed during the pullback) rather than at an arbitrary fixed distance.
In the first half of 2026, EUR/USD generated four significant EMA crossover setups on the 4-hour chart, each producing between 120 and 380 pips of directional movement before the trend exhausted. USD/JPY produced five setups, reflecting the continued influence of BOJ policy adjustments on that pair's medium-term direction.
Risk-Reward Ratios for Swing Trading: Targeting 1:2 and Beyond
Risk-reward ratio is the mathematical relationship between the amount risked on a trade and the amount targeted as profit. A 1:2 risk-reward ratio means that for every pip risked, two pips of profit are targeted. On a trade where the stop loss is 60 pips and the take profit is 120 pips, the risk-reward is 1:2.
The power of a consistent minimum 1:2 risk-reward ratio becomes evident through simple mathematics. If a swing trader wins 45% of their trades (losing the majority) and consistently achieves 1:2 risk-reward on every trade, the strategy is still mathematically profitable. At 1:2 risk-reward and 45% win rate, for every 100 trades: 45 winners produce 45 times 2 = 90 units of reward, while 55 losers produce 55 times 1 = 55 units of loss. Net result: 35 units of profit per 100 trades before costs.
This mathematical reality explains why risk-reward ratio is often more important than win rate in determining long-term profitability. A trader with a 70% win rate but 1:0.5 risk-reward (risking twice what they gain) is losing money. A trader with a 40% win rate and 1:3 risk-reward is significantly profitable.
For swing trading on the 4-hour chart in 2026, a practical approach to setting take profit levels uses previous swing highs and lows as natural targets. If entering long at a swing low with a 60-pip stop, the take profit is placed at the most recent swing high, which in many EUR/USD 4-hour setups is 150 to 300 pips away, creating risk-reward ratios of 1:2.5 to 1:5 on a single trade.
Partial profit taking is a valuable modification of the take-profit approach. Taking 50% of the position off at 1:1.5 risk-reward and moving the stop to breakeven on the remaining 50% creates a risk-free second portion of the trade that can be held for the extended 1:3 or 1:4 target. This approach significantly reduces the psychological pressure of holding a trade through temporary retracements.
Building a Weekly Swing Trading Routine in 2026
The efficiency of swing trading comes from its structured, low-frequency approach to market engagement. A complete weekly routine for a 4-hour swing trader requires approximately three to four hours of total chart time across the week.
Sunday evening (30 minutes): Perform top-down analysis on all pairs being monitored. Check the daily chart for trend direction and key levels. Mark significant support and resistance on the 4-hour chart. Identify which pairs have the clearest potential setup developing entering the new week.
Monday to Friday (20 to 30 minutes per session check, twice per day): At the London open (07:00 GMT) and the New York open (13:00 GMT), check the 4-hour charts of monitored pairs. Confirm whether any setups have matured, whether existing trades need to be managed (trailing stops or partial profit taking), and whether any new setups have become valid.
Friday (20 minutes): Review the week's trades against the system rules. Identify any rule deviations. Record results in the trading journal. Close any trades that you are not comfortable holding over the weekend, as geopolitical events and economic announcements can cause significant gap openings when markets reopen Sunday evening.
This routine keeps a swing trader engaged with the market without the emotional exhaustion that comes from constant screen time, and it provides enough touchpoints with the chart to manage positions effectively.
Key Takeaways for Swing Traders in 2026
Swing trading on the 4-hour chart offers one of the best balances of opportunity, time efficiency, and psychological manageability among all forex trading styles. The EMA crossover system provides objective entry triggers. Swing high and low analysis defines the trend framework within which only high-probability directional trades are taken. A minimum 1:2 risk-reward ratio ensures profitability even at win rates below 50%. The 1% risk rule applied consistently across all setups protects capital through inevitable losing periods. Practice the full system on a demo account for at least 60 days, logging every trade with the full system checklist, before applying it to live capital.
Financial Disclaimer: This content is for educational purposes only and does not constitute financial advice. Forex trading carries significant risk of loss. Please trade responsibly and seek professional financial guidance before committing real capital.