How to Read Forex Charts: Candlestick Patterns Every Trader Must Know in 2026
Financial Disclaimer: This article is for educational purposes only and does not constitute financial advice. Trading forex and CFDs involves significant risk. Past pattern performance does not guarantee future results.
Technical analysis in forex begins with one foundational skill: the ability to read a price chart. Among the various chart types available on modern trading platforms, the candlestick chart is the industry standard, used by retail traders, institutional desks, and prop trading firms alike. Originating from 18th-century Japanese rice trading, candlestick charting was brought to Western financial markets by Steve Nison in the early 1990s and has since become the dominant method of price visualization across every financial market.
In 2026, every major trading platform from MetaTrader 4 and 5 to TradingView, cTrader, and broker proprietary platforms defaults to the candlestick chart. Understanding what each candle communicates about market sentiment, and recognizing the patterns formed by sequences of candles, is not optional knowledge for a forex trader. It is the foundation upon which all technical analysis is built.
What Is a Candlestick Chart and How Do You Read It?
- How to Read Forex Charts: Candlestick Patterns Every Trader Must Know in 2026
- What Is a Candlestick Chart and How Do You Read It?
- The 10 Most Reliable Bullish Candlestick Patterns with Examples
- Bearish Candlestick Patterns That Signal Price Reversals
- Combining Candlestick Patterns with Volume for Stronger Signals
- Common Candlestick Reading Mistakes Beginners Make
- Key Takeaways on Candlestick Pattern Trading in 2026
Each candlestick on a chart represents price action over a specific time period. On a one-hour chart, each candle represents 60 minutes of trading. On a daily chart, each candle represents one full trading day. The time period is called the timeframe, and traders monitor multiple timeframes simultaneously to build a complete picture of market structure.
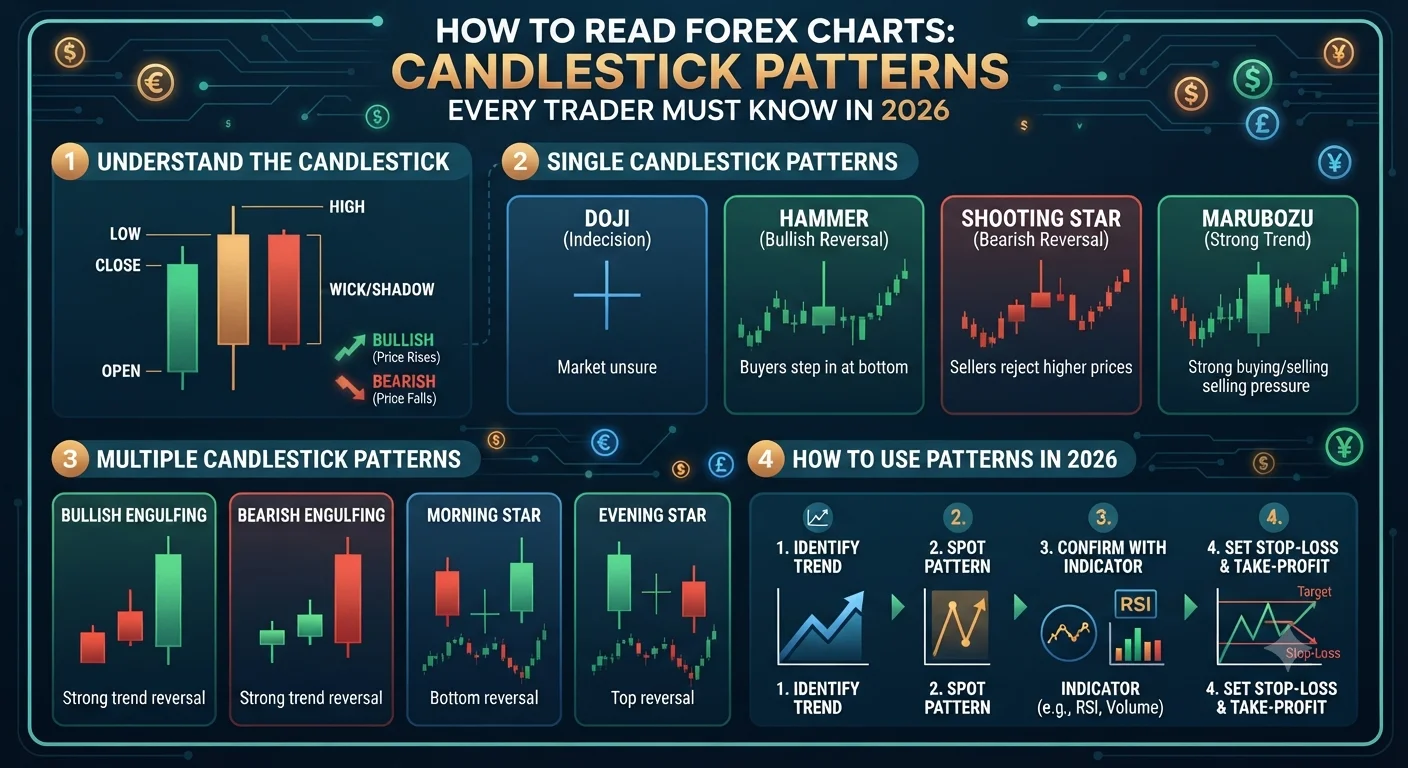
Every candlestick has four data points: the open price (where the candle began), the close price (where the candle ended), the high price (the highest price reached during the period), and the low price (the lowest price reached during the period). These four values create the visual structure of the candle.
The body of the candle is the thick rectangular section that spans from the open to the close. If the close is higher than the open, the candle is bullish and is typically colored green or white on most platforms, indicating that buyers controlled the period. If the close is lower than the open, the candle is bearish and is colored red or black, indicating seller dominance.
The thin lines extending above and below the body are called wicks or shadows. The upper wick extends from the body to the session high, and the lower wick extends from the body to the session low. These wicks reveal price rejection: an upper wick shows that buyers pushed price higher but sellers ultimately rejected those levels before the close. A long lower wick signals that sellers drove price down but buyers stepped in aggressively and pushed it back up.
A candle with a very long body and short wicks signals strong conviction from either buyers or sellers. A candle with a small body and long wicks on both sides signals indecision and a potential balance of power between buyers and sellers. This basic reading of candle anatomy already provides enormous information about market sentiment before any pattern analysis begins.
The 10 Most Reliable Bullish Candlestick Patterns with Examples
Bullish candlestick patterns signal that buying pressure is increasing and that price may be preparing to move higher. They carry the most significance when they appear at established support levels, at the end of a downtrend, or at key Fibonacci retracement zones.
The Hammer is formed when a candle has a small body near the top of its range, a very long lower wick (at least twice the length of the body), and little to no upper wick. The long lower wick demonstrates that sellers pushed price significantly lower during the session but buyers reversed the move, closing near the open. A hammer after a sustained downtrend is one of the most reliable single-candle reversal signals in forex technical analysis.
The Bullish Engulfing pattern requires two candles. The first is a bearish (red) candle. The second is a bullish (green) candle whose body completely engulfs or covers the body of the preceding bearish candle. This pattern signals that buyers have overwhelmed sellers and that momentum is shifting to the upside. When a bullish engulfing appears at a major support level with increased volume, it carries a high degree of reliability.
The Morning Star is a three-candle pattern that signals reversal after a downtrend. The first candle is a large bearish candle continuing the downtrend. The second is a small-bodied candle (called a Doji or spinning top) that gaps lower, indicating indecision. The third is a large bullish candle that closes well into the body of the first candle, confirming the reversal. The morning star is the bullish counterpart of the evening star.
The Piercing Line occurs when a bearish candle is followed by a bullish candle that opens below the previous close but closes above the midpoint of the previous bearish candle's body. It signals partial reversal of selling pressure and is typically seen at the end of short-term downtrends.
The Bullish Harami is the opposite of the engulfing pattern. A large bearish candle is followed by a small bullish candle whose body is entirely contained within the body of the previous candle. This pattern signals that the prevailing bearish momentum is decelerating, though it is a weaker signal than the engulfing and typically requires confirmation from the next candle.
The Dragonfly Doji is a candle where the open, high, and close are all at or near the same level, with a very long lower wick. It looks like the letter T and appears when sellers drive price lower during the session but buyers completely reverse the move by the close. At support levels, the dragonfly doji is a powerful single-candle reversal signal.
The Three White Soldiers pattern consists of three consecutive large bullish candles, each opening within or above the body of the previous candle and closing progressively higher. This pattern signals strong and sustained buying pressure and is typically a continuation signal when it appears after a brief consolidation in an uptrend, or a powerful reversal signal after a deep downtrend.
Recommended Articles
 TECHNICAL ANALYSIS
 TECHNICAL ANALYSIS
 TECHNICAL ANALYSIS
 TECHNICAL ANALYSIS
The Bullish Marubozu is a large bullish candle with no upper or lower wick, meaning the open is equal to the session low and the close is equal to the session high. It signals complete buyer dominance throughout the entire period with no meaningful resistance from sellers at any point. In an uptrend, the Marubozu confirms strong momentum continuation.
The Rising Three Methods is a five-candle continuation pattern. A large bullish candle is followed by three small bearish candles that stay within the range of the first candle, then a fifth large bullish candle closes above the high of the first. This pattern signals that the temporary pullback against the uptrend has been absorbed and that the trend is resuming with conviction.
The Inverted Hammer appears at the bottom of a downtrend and has a small body at the lower end of the range with a long upper wick and little to no lower wick. It signals that buyers attempted to push price higher during the session, and while they did not fully succeed by the close, the attempt itself indicates changing sentiment. The inverted hammer requires confirmation from the next candle before being acted upon.
Bearish Candlestick Patterns That Signal Price Reversals
Bearish patterns carry the most significance when they appear at resistance levels, at the end of an uptrend, or at Fibonacci extension targets where price has potentially overextended.
The Shooting Star is the bearish mirror of the hammer. It has a small body near the low of its range, a very long upper wick (at least twice the body length), and little to no lower wick. It appears after an uptrend and signals that buyers pushed price significantly higher during the session, but sellers rejected those levels decisively before the close. The rejection of higher prices signals that the uptrend may be losing momentum.
The Bearish Engulfing is the bearish version of the bullish engulfing. A bullish candle is followed by a bearish candle whose body completely engulfs the previous candle's body. It signals that sellers have overpowered buyers and is most significant when it forms at a well-established resistance level on a higher timeframe chart.
The Evening Star mirrors the morning star. A large bullish candle is followed by a small indecision candle, then a large bearish candle that closes well into the body of the first candle. It signals a meaningful reversal of bullish momentum and is one of the most respected three-candle reversal patterns in professional technical analysis.
The Hanging Man has the same visual structure as the hammer but appears after an uptrend rather than a downtrend. Its long lower wick, in the context of a prevailing uptrend, signals that sellers are beginning to probe lower prices during sessions, and that the uptrend may be at risk of reversing. Like the inverted hammer, it requires candle confirmation.
The Gravestone Doji mirrors the dragonfly doji but at market tops. The open, low, and close are all at or near the same level, with a long upper wick extending above. It signals that buyers pushed price higher during the session but were completely overwhelmed by sellers by the close, leaving the candle to close back at its lows.
Combining Candlestick Patterns with Volume for Stronger Signals
Volume is the quantitative data that either validates or undermines the story told by a candlestick pattern. A bullish engulfing pattern that forms on dramatically higher volume than the preceding bearish candle carries exponentially more weight than the same pattern on average or declining volume. The increased volume confirms that a significant number of market participants are acting on the reversal signal, making the follow-through more likely.
In forex, true volume data is not available because the market is decentralized and there is no single exchange reporting consolidated transaction volume. However, tick volume (the number of price ticks per candle, available on all MetaTrader and TradingView charts) serves as a reliable proxy for actual trading activity. Academic research, including studies by the Humboldt-Universität zu Berlin on tick volume in forex markets, has demonstrated that tick volume correlates strongly with true traded volume in the interbank market.
In 2026, the standard practice for volume-confirmed candlestick trading is to compare the volume of any signal candle to its 20-period moving average of volume. A signal candle with volume at least 1.5 times above the 20-period average is considered volume-confirmed and receives higher probability weighting.
Common Candlestick Reading Mistakes Beginners Make
The single most common error is trading candlestick patterns in isolation without considering the broader market context. A hammer candle in the middle of a strong, unbroken downtrend carries very little reversal significance. The same pattern appearing at a major weekly support level, a 61.8% Fibonacci retracement, and a round-number psychological level carries substantial significance. Context transforms pattern probability dramatically.
The second most common error is ignoring the timeframe hierarchy. A bearish engulfing on a one-minute chart is nearly noise. The same pattern on a four-hour chart represents four hours of market sentiment shift. Always apply candlestick patterns in the context of your primary analysis timeframe and confirm against the next higher timeframe before committing capital.
Third is failing to wait for candle close. Many traders see a potential pattern forming mid-candle and enter immediately. Until a candle has fully closed, its pattern can change completely. A candle that looks like a hammer 30 minutes into a one-hour period may close as a large bearish candle. Always wait for the candle to close and the new candle to open before acting on any candlestick signal.
Key Takeaways on Candlestick Pattern Trading in 2026
Candlestick charts communicate four data points per period: open, high, low, and close. The body reveals who won the battle between buyers and sellers, while the wicks reveal the prices that were rejected. The ten bullish patterns detailed here, from the hammer to the three white soldiers, each signal increasing buyer pressure in specific ways. Bearish patterns like the shooting star, evening star, and bearish engulfing signal seller dominance and potential reversals. Volume confirmation, broader market context, and timeframe selection determine whether any pattern has a high or low probability of follow-through.