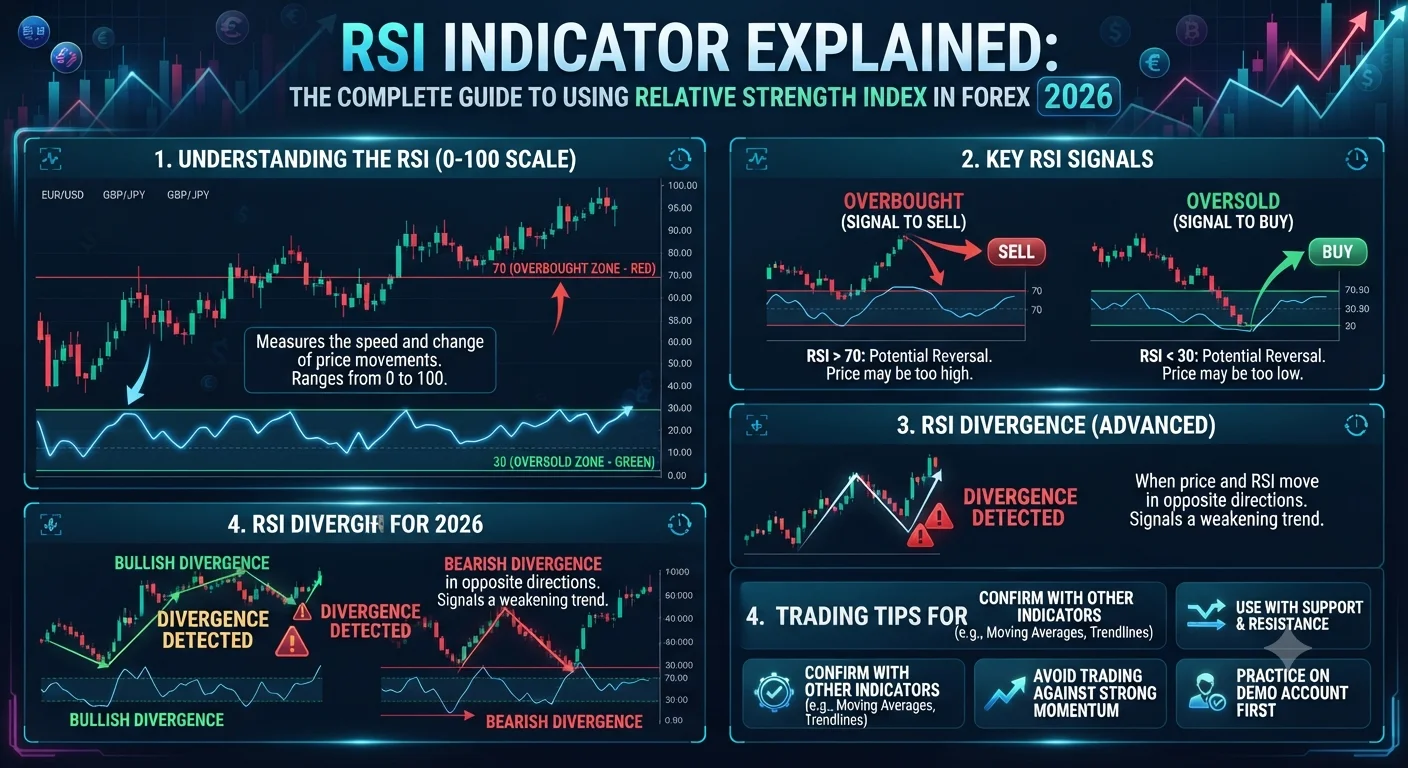
The Relative Strength Index (RSI) is a momentum oscillator developed by J. Welles Wilder in 1978 that measures the speed and magnitude of recent price changes to evaluate whether an asset is overbought or oversold. It moves on a scale of 0 to 100. Readings above 70 traditionally signal overbought conditions where a reversal lower may be approaching. Readings below 30 signal oversold conditions where a reversal higher may be developing. In 2026, the RSI remains one of the three most widely used technical indicators in forex trading globally, valued not just for its overbought and oversold signals but for its divergence patterns that can identify trend reversals before price confirms them.
What Is the RSI Indicator and How Is It Calculated?
The Relative Strength Index was introduced by J. Welles Wilder Jr. in his landmark 1978 book New Concepts in Technical Trading Systems, the same publication that also introduced the Average True Range and the Parabolic SAR. Wilder designed the RSI to answer a straightforward question: is the recent price movement indicating abnormal strength or weakness, and is that strength or weakness sustainable?
The RSI is calculated over a lookback period, with 14 periods being the default setting that Wilder himself recommended and that remains the most widely used setting in 2026. The calculation involves the following steps.
First, identify all up closes and all down closes over the past 14 candles. Calculate the average gain by summing all up-close movements and dividing by 14. Calculate the average loss by summing all down-close movements (expressed as positive values) and dividing by 14.
Second, calculate the Relative Strength (RS) by dividing the average gain by the average loss.
Third, apply the RSI formula: RSI equals 100 minus (100 divided by (1 plus RS)).
The result is a value between 0 and 100. An RSI of 70 means that recent upward price movement has been roughly 2.3 times larger than recent downward price movement over the 14-period lookback, indicating significant bullish momentum. An RSI of 30 means the opposite: recent downward movement has been roughly 2.3 times the upward movement.
After the initial calculation, subsequent RSI values use a smoothed average gain and loss (similar to an exponential moving average) rather than a simple average, which prevents sudden large candles from distorting the reading. This smoothing is handled automatically by every trading platform and charting application in 2026, including MetaTrader 4, MetaTrader 5, TradingView, and cTrader.
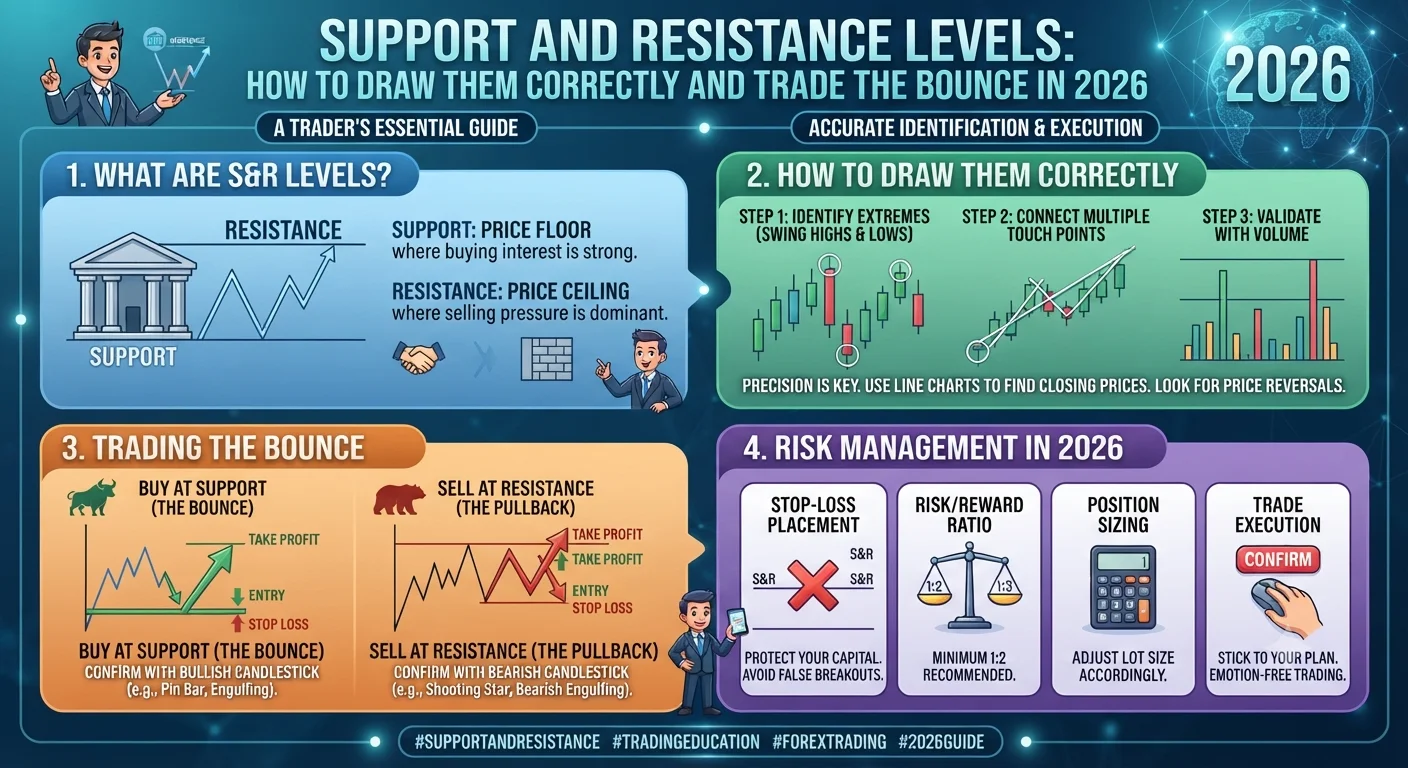
- Support and Resistance Levels: How to Draw Them Correctly and Trade the Bounce in 2026
- How to Read Forex Charts: Candlestick Patterns Every Trader Must Know in 2026
Understanding the calculation, even at this conceptual level, helps traders interpret what the RSI is actually telling them rather than treating it as a black box signal generator. The RSI is measuring momentum, specifically the relative magnitude of gains versus losses. When it rises sharply, it tells you that recent price gains have been disproportionately large. When it falls sharply, recent losses have dominated.
RSI Overbought and Oversold Signals: 70/30 Versus 80/20 Levels
- What Is the RSI Indicator and How Is It Calculated?
- RSI Overbought and Oversold Signals: 70/30 Versus 80/20 Levels
- RSI Divergence: The Most Powerful Signal Most Traders Miss
- Combining RSI with Trend Lines for High-Probability Setups
- RSI Settings: Which Period Works Best for Different Timeframes?
- Key Takeaways on RSI Trading in 2026
The traditional interpretation of RSI uses 70 as the overbought threshold and 30 as the oversold threshold. When RSI rises above 70, price is considered to be in overbought territory where buying momentum may be excessive and a pullback or reversal is possible. When RSI falls below 30, price is considered oversold where selling momentum may be exhausted and a bounce or reversal becomes more probable.
However, using overbought and oversold signals in isolation is one of the most common and costly mistakes forex traders make. In a strong trending market, RSI can remain above 70 for extended periods as price continues to trend higher. Shorting purely because RSI crossed above 70 in an established uptrend has resulted in enormous losses for countless traders who misapplied the indicator.
The 2026 professional approach to RSI overbought and oversold signals uses context-dependent thresholds rather than the universal 70/30 rule.
In a ranging market with no clear directional trend, the 70/30 thresholds work well. Price oscillates between support and resistance while RSI oscillates between 70 and 30, generating reliable reversal signals at each extreme. Buying when RSI dips below 30 at support and selling when RSI exceeds 70 at resistance produces a clean, repeatable strategy in range-bound conditions.
In a strong uptrend, adjust the reference levels to 80/40. RSI will frequently touch or slightly exceed 70 during normal pullbacks in a bull trend without signaling a genuine reversal. A reading above 80 carries more significance in a trending market. Oversold conditions in an uptrend are better defined by RSI reaching the 40 to 45 zone, which often represents a healthy pullback buying opportunity rather than a 30 reading which may indicate trend breakdown.
In a strong downtrend, the mirror applies: use 60/20. RSI rallies to 55 to 60 often represent selling opportunities in a downtrend, while readings below 20 are more meaningful oversold signals than the standard 30 threshold.
Combining RSI overbought and oversold readings with the location of established support and resistance levels dramatically improves their reliability. An RSI below 30 at a major daily support level is a high-probability long setup. An RSI below 30 in the middle of a clean downtrend with no structural support nearby is a low-probability contrarian bet that most experienced traders avoid.
RSI Divergence: The Most Powerful Signal Most Traders Miss
RSI divergence is the most valuable and consistently underused feature of the indicator. It occurs when the direction of RSI movement contradicts the direction of price movement, signaling that the prevailing trend is losing momentum internally even before price has reversed.
There are two primary types of RSI divergence: regular divergence (which signals reversals) and hidden divergence (which signals trend continuation).
Regular Bullish Divergence occurs when price makes a lower low (a new swing low below the previous swing low) but RSI makes a higher low (the RSI reading at the new price low is above the RSI reading at the previous price low). This divergence signals that despite price falling to a new low, selling momentum is actually weakening. Fewer sellers are participating in each new low, suggesting that the downtrend is losing its internal strength and a reversal higher may be imminent.
Regular bullish divergence is most powerful when it forms at a significant support level and is accompanied by a bullish reversal candlestick pattern such as a hammer or bullish engulfing. In that scenario, three independent signals (structural support, RSI divergence, and candlestick reversal) are all pointing to the same conclusion: selling is exhausted, and buying is beginning to take control.
Recommended Articles
 TECHNICAL ANALYSIS
 TECHNICAL ANALYSIS
 TECHNICAL ANALYSIS
 TECHNICAL ANALYSIS
Regular Bearish Divergence is the mirror: price makes a higher high (a new swing high above the previous swing high) but RSI makes a lower high (the RSI reading at the new price high is below the RSI reading at the previous price high). Despite new highs in price, fewer buyers are participating and momentum is decaying. This is frequently seen in the final stage of an uptrend before a meaningful reversal, and it warned of many significant EUR/USD and GBP/USD tops throughout 2024 and 2025.
Hidden Bullish Divergence occurs when price makes a higher low (a normal pullback in an uptrend) but RSI makes a lower low. This sounds counterintuitive but it signals continuation of the uptrend. The higher price low confirms the uptrend structure while the lower RSI low simply reflects the depth of the pullback in momentum terms. Hidden bullish divergence is a powerful signal to add to or enter long positions during pullbacks in established uptrends.
Hidden Bearish Divergence occurs when price makes a lower high (a rally in a downtrend) but RSI makes a higher high. It signals that the downtrend is intact and the current rally is a temporary correction, providing an entry opportunity for short positions.
The practical workflow for divergence trading is straightforward. When price is approaching a significant structural level (support for potential longs, resistance for potential shorts), apply the RSI to the chart and look for divergence between price swings and RSI swings. If divergence is present at a major structural level, the probability of a meaningful reaction at that level increases substantially. Confirmation from a candlestick reversal pattern at that level before entering provides the final filter for a high-quality setup.
Combining RSI with Trend Lines for High-Probability Setups
Beyond its use as a standalone signal tool, RSI produces additional analytical value when its own movement is analyzed with trend line analysis applied directly to the RSI panel rather than the price chart.
Drawing a trend line on the RSI itself (connecting a series of RSI highs in a downtrending RSI or RSI lows in an uptrending RSI) allows traders to identify RSI trend line breaks, which often precede price trend line breaks by one to three candles. When the RSI breaks its own trend line before price has broken a visible chart trend line, it provides an early warning signal that a price trend line break may be imminent, giving traders time to prepare an entry rather than reacting after the fact.
Another powerful combination is pairing RSI with moving averages on the price chart. When the 50-period EMA on the 4-hour chart is sloping upward (confirming an uptrend) and RSI dips into the 40 to 45 zone (the adjusted oversold level for an uptrend, as discussed above) and then turns upward, the combination of trend-following MA confirmation and RSI momentum turning point creates a high-confluence long entry signal. This combination has been a consistent feature of high-probability setups on EUR/USD and AUD/USD throughout the first half of 2026.
The discipline required with RSI combinations is to wait for the RSI to turn (not just reach an extreme) before entering. The turn confirms that momentum has begun shifting. Entering while RSI is still falling, even at extreme levels, means entering into ongoing momentum against you. Waiting for the turn may cost a few pips of the initial move but significantly improves the probability that the setup will follow through.
RSI Settings: Which Period Works Best for Different Timeframes?
The default 14-period RSI is the most widely recognized setting in 2026 and remains appropriate for most swing trading applications on the 4-hour and daily charts. However, different trading styles benefit from different RSI period settings.
Scalping on the 1-minute and 5-minute charts: A shorter RSI period of 7 or 9 is more appropriate for very short timeframe trading. The 14-period RSI on a 1-minute chart reacts too slowly to be useful for a strategy targeting 5 to 15-pip moves in real time. The 7-period RSI reaches extreme levels faster and returns from them faster, generating the rapid signals that scalpers require.
Day trading on the 15-minute and 1-hour charts: The standard 14-period RSI works well for day trading. Some day traders prefer a slightly faster 9-period RSI on the 1-hour chart to increase signal frequency while still filtering out the noise of very short timeframes.
Swing trading on the 4-hour and daily charts: The 14-period RSI is optimal. On these timeframes, 14 periods covers a meaningful stretch of market history (56 hours on the 4-hour chart, 14 trading days on the daily chart) that captures genuine momentum shifts rather than temporary noise.
Position trading on the weekly chart: A longer 21-period RSI reduces whipsaws on the weekly chart and keeps traders focused on major momentum shifts that correspond to multi-month trends.
Regardless of the period setting, the principles of divergence analysis, context-dependent overbought and oversold levels, and multi-indicator confirmation remain constant. The period setting simply controls how quickly the RSI reacts to price changes. A shorter period is more sensitive but generates more false signals. A longer period is smoother but more lag-prone. The optimal setting is always the one that best matches the speed of price action on your chosen timeframe and trading style.
Key Takeaways on RSI Trading in 2026
The RSI indicator is a momentum measurement tool that reveals the relative magnitude of recent gains versus losses, with readings above 70 signaling overbought conditions and readings below 30 signaling oversold conditions in standard market conditions. Context-dependent threshold adjustments (80/40 in uptrends and 60/20 in downtrends) improve the accuracy of overbought and oversold signals significantly. RSI divergence, both regular and hidden, is the indicator's most powerful feature and provides early warning of trend exhaustion and continuation before price confirms the move. Combining RSI with structural levels, candlestick patterns, and moving average trend filters creates the high-confluence setups that form the foundation of consistent technical trading.
Financial Disclaimer: This content is for educational purposes only and does not constitute financial advice. All trading involves substantial risk of loss. Past indicator performance does not guarantee future results. Please seek independent professional guidance before trading.