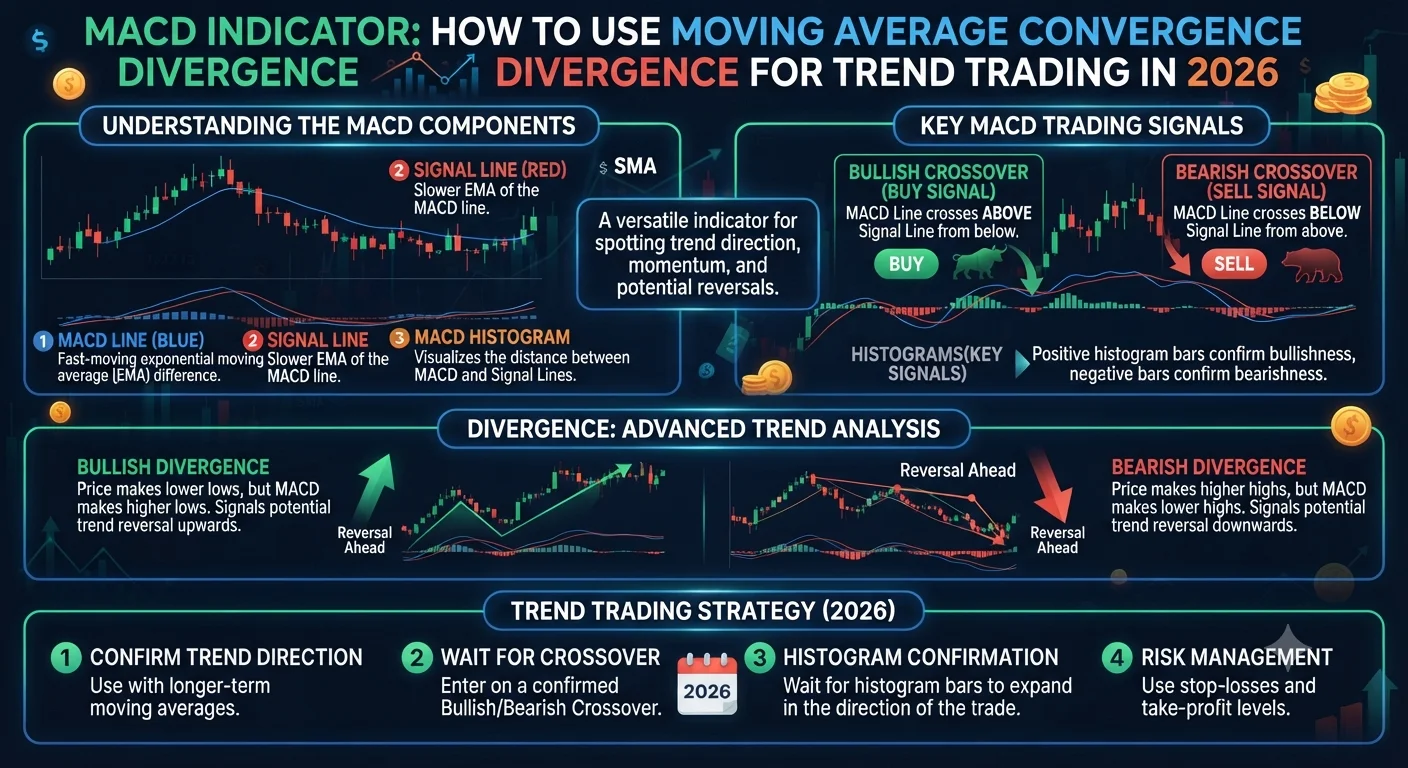
The MACD (Moving Average Convergence Divergence) is a trend-following momentum indicator developed by Gerald Appel in the late 1970s. It consists of three components: the MACD line (the difference between the 12-period and 26-period EMA), the signal line (a 9-period EMA of the MACD line), and the histogram (the difference between the MACD line and the signal line). When the MACD line crosses above the signal line, it generates a bullish signal. When it crosses below, a bearish signal. In 2026, the MACD remains one of the most popular forex trend indicators because it simultaneously measures trend direction, momentum strength, and potential reversal points through a single visual display.
What Is MACD and How Does the Indicator Work?
Gerald Appel developed the MACD in the late 1970s as a tool to identify changes in the strength, direction, momentum, and duration of a trend. Unlike single moving averages that simply show direction, the MACD shows the relationship between two moving averages, making it inherently more informative about momentum dynamics.
The MACD is built from three calculated values that are displayed as an overlay in a separate panel below the price chart.
The MACD line is calculated by subtracting the 26-period Exponential Moving Average from the 12-period Exponential Moving Average. When the 12-period EMA is above the 26-period EMA, the MACD line is positive, indicating that short-term momentum is stronger than medium-term momentum, which is characteristic of a bullish trend phase. When the 12-period EMA is below the 26-period EMA, the MACD line is negative, indicating bearish momentum dominance.
The signal line is a 9-period EMA applied to the MACD line itself. Because it is a moving average of the MACD line, it is smoother and slower to react. The crossover between the MACD line and the signal line is the primary trading signal generated by the indicator.
The histogram is perhaps the most visually informative component. It displays the difference between the MACD line and the signal line as bars above and below a zero centerline. When the histogram bars are growing (increasing in height above zero), bullish momentum is accelerating. When they are shrinking (decreasing in height toward zero), bullish momentum is decelerating. The same logic applies in reverse below zero for bearish momentum. Critically, the histogram reveals momentum shifts before they are confirmed by an actual MACD-signal line crossover, giving traders an early warning system.
The default MACD settings of 12, 26, and 9 are used across the vast majority of forex trading setups in 2026 and form the basis of all analysis in this guide. Alternative settings are discussed in the final section.
MACD Histogram: Reading Momentum Shifts Before Price Moves
- What Is MACD and How Does the Indicator Work?
- MACD Histogram: Reading Momentum Shifts Before Price Moves
- Bullish and Bearish MACD Crossover Signals with Examples
- MACD Divergence as an Early Trend Reversal Warning
- Best Timeframes and Settings for MACD in Forex Trading
- Key Takeaways on MACD Trading in 2026
The histogram is the most underutilized component of the MACD display, and it is arguably the most powerful. While most traders focus on the MACD and signal line crossovers as their primary signal, the histogram often telegraphs these crossovers several candles in advance through a process called histogram divergence with price.
When the MACD histogram bars above zero begin shrinking (each bar is shorter than the previous one) while price is still rising or moving sideways, it signals that bullish momentum is decelerating. Buyers are becoming less aggressive. The upward price movement is continuing on diminishing fuel. This histogram behavior frequently precedes a bearish MACD crossover and a price reversal by two to five candles, giving an alert trader time to begin tightening stops on long positions or looking for reversal entry signals.
Conversely, when histogram bars below zero begin shrinking in absolute size (each negative bar is less negative than the previous one) while price is still falling or consolidating, bearish momentum is fading. This often precedes a bullish MACD crossover and a price reversal to the upside.
In practical application, a complete MACD-based trading process monitors the histogram constantly for these momentum shift signals. When the histogram begins contracting in either direction, the trader enters a heightened alert state: watching for crossover confirmation, checking RSI for divergence, and preparing entry or exit orders at the anticipated reversal level.
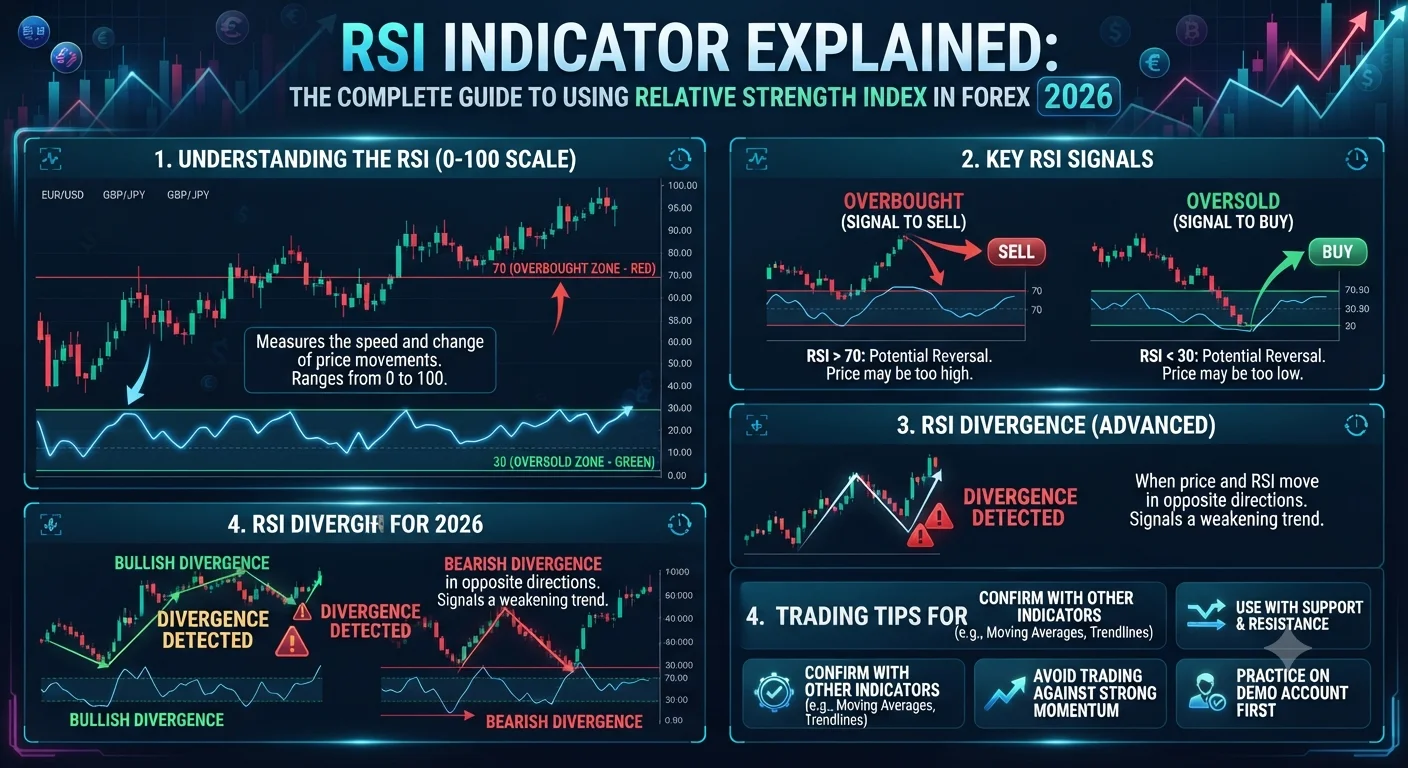
- RSI Indicator Explained: The Complete Guide to Using Relative Strength Index in Forex 2026
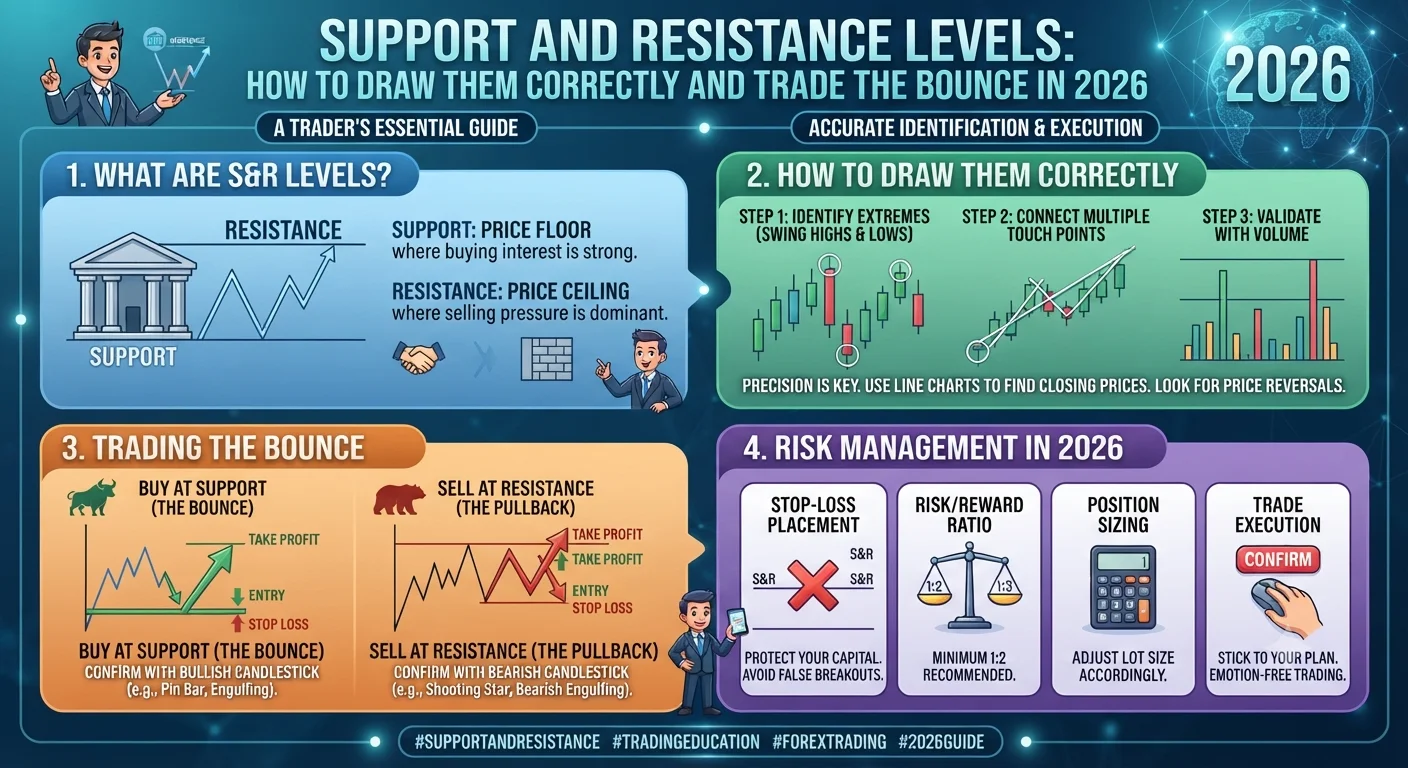
- Support and Resistance Levels: How to Draw Them Correctly and Trade the Bounce in 2026
- How to Read Forex Charts: Candlestick Patterns Every Trader Must Know in 2026
Throughout the first half of 2026, histogram momentum contraction signals on the 4-hour USD/JPY chart preceded three significant trend reversals of 120 to 280 pips, all of which became visible in the histogram two to four candles before the MACD-signal line crossover confirmed the directional change. Traders who use only the crossover as their signal missed the optimal entry in all three cases.
Bullish and Bearish MACD Crossover Signals with Examples
The MACD crossover is the most commonly used signal generated by the indicator and is available as an automatic alert in MetaTrader, TradingView, and virtually every major platform in 2026.
Bullish MACD crossover: Occurs when the MACD line crosses from below to above the signal line. This signals that short-term momentum (the 12-period EMA) has accelerated faster than medium-term momentum (the 26-period EMA), indicating an increase in bullish pressure. The crossover is considered stronger when it occurs below the zero line (the MACD and signal lines are both negative) because it signals a shift from bearish to neutral or bullish territory, rather than a mere acceleration within an already positive zone.
Bearish MACD crossover: Occurs when the MACD line crosses from above to below the signal line. This signals that short-term momentum has weakened relative to medium-term momentum, indicating increasing bearish pressure. The crossover is considered strongest when it occurs above the zero line, signaling a shift from bullish to neutral or bearish territory.
Recommended Articles
 TECHNICAL ANALYSIS
 TECHNICAL ANALYSIS
 TECHNICAL ANALYSIS
 TECHNICAL ANALYSIS
A real-world illustration from the GBP/USD daily chart in early 2026: following the Bank of England's February 2026 rate decision, GBP/USD entered a sustained downtrend. The MACD generated a bearish crossover above the zero line on the daily chart three days after the BOE decision, with both the MACD line and signal line still positive but the MACD falling below the signal. This crossover occurred at approximately 1.2680 and preceded a move to 1.2380 over the following three weeks, a distance of 300 pips. Traders who acted on the crossover with proper risk management had ample opportunity to capture a significant portion of this move.
The primary limitation of MACD crossovers used alone is their lag. Because both the MACD line and signal line are calculated from moving averages, they inherently trail price. In fast-moving or highly volatile markets, a crossover signal may appear well after the initial move has begun, resulting in entries that are suboptimal from a risk-reward perspective. This is why the histogram momentum contraction approach described above is valuable as an early warning system that reduces the lag inherent in crossover signals.
MACD Divergence as an Early Trend Reversal Warning
Just as RSI divergence signals momentum exhaustion before price confirms a reversal, MACD divergence performs the same function with slightly different characteristics.
Bullish MACD divergence occurs when price makes a new lower low but the MACD line (or histogram) makes a higher low at the same time. The price chart shows continued bearish pressure, but the MACD reveals that the selling momentum driving those new lows is weaker than the momentum that drove the previous low. Fewer sellers are participating at each new price low. The trend is losing its internal engine.
Bearish MACD divergence occurs when price makes a new higher high but the MACD line makes a lower high simultaneously. Price is still rising, but the buying momentum behind the new highs is decelerating. The uptrend may be approaching exhaustion.
MACD divergence tends to produce signals of longer duration than RSI divergence because it is based on moving average calculations rather than raw price momentum. An MACD divergence signal might remain valid across five to ten candles before resolving into a reversal, whereas RSI divergence can resolve within two or three candles. This characteristic makes MACD divergence particularly useful for daily and weekly chart analysis where traders are looking for medium to longer-term trend reversal signals.
The highest-probability MACD divergence setups occur when MACD divergence and RSI divergence both appear simultaneously at the same price level. If EUR/USD is making new highs and both the MACD histogram and the RSI are making lower highs at the same time, two independent momentum indicators are confirming the same loss of bullish conviction. The probability of a meaningful reversal from that zone is substantially higher than when only one indicator shows divergence.
Best Timeframes and Settings for MACD in Forex Trading
The standard 12-26-9 MACD settings work well across most timeframes for most traders in 2026. However, specific trading styles benefit from parameter adjustments.
For scalping on the 5-minute chart: A faster MACD setting of 5-13-5 or 8-17-9 reduces the lag of the standard settings and generates more frequent crossovers suited to the rapid decision requirements of scalping. However, faster settings also generate more false signals, requiring stricter additional confirmation before entry.
For day trading on the 1-hour chart: The standard 12-26-9 setting is well-suited for hourly analysis, where each period represents one hour of genuine price action. Some day traders prefer 8-21-5 for slightly increased sensitivity on the 1-hour chart.
For swing trading on the 4-hour and daily charts: The standard 12-26-9 setting is optimal. On these timeframes, the inherent lag of the indicator is less problematic because even a slightly lagged entry on a 150 to 400-pip swing trade still provides excellent risk-reward.
For position trading on the weekly chart: A slower setting of 24-52-18 (double the standard) reduces noise and keeps the indicator focused on major, multi-month trend changes rather than the shorter-term swings that are irrelevant to a long-term position approach.
One additional MACD application that is growing in use among professional traders in 2026 is the zero-line cross. When the MACD line crosses above the zero centerline (meaning the 12-period EMA has crossed above the 26-period EMA), it is a more significant signal than a standard crossover above the signal line because it confirms that medium-term momentum has actually shifted from bearish to bullish. Zero-line crosses generate fewer signals than standard crossovers but have a meaningfully higher accuracy rate on the daily and weekly charts.
Key Takeaways on MACD Trading in 2026
The MACD indicator combines trend direction, momentum strength, and reversal early warning into a single, visually intuitive display. The histogram is the most information-rich component and should be monitored for momentum contraction before crossovers occur. Standard crossover signals are reliable in clearly trending markets but lag-prone in choppy conditions. MACD divergence, particularly when confirmed simultaneously by RSI divergence, provides the highest-probability reversal setups available from indicator-based analysis. The zero-line cross is a higher-conviction version of the standard crossover, particularly valuable on the daily and weekly charts. Practice identifying all three signal types on historical charts before trading them live.
Financial Disclaimer: This content is for educational purposes only and does not constitute financial advice. Forex trading involves significant risk of loss. Always conduct independent research and seek professional guidance before making trading decisions.