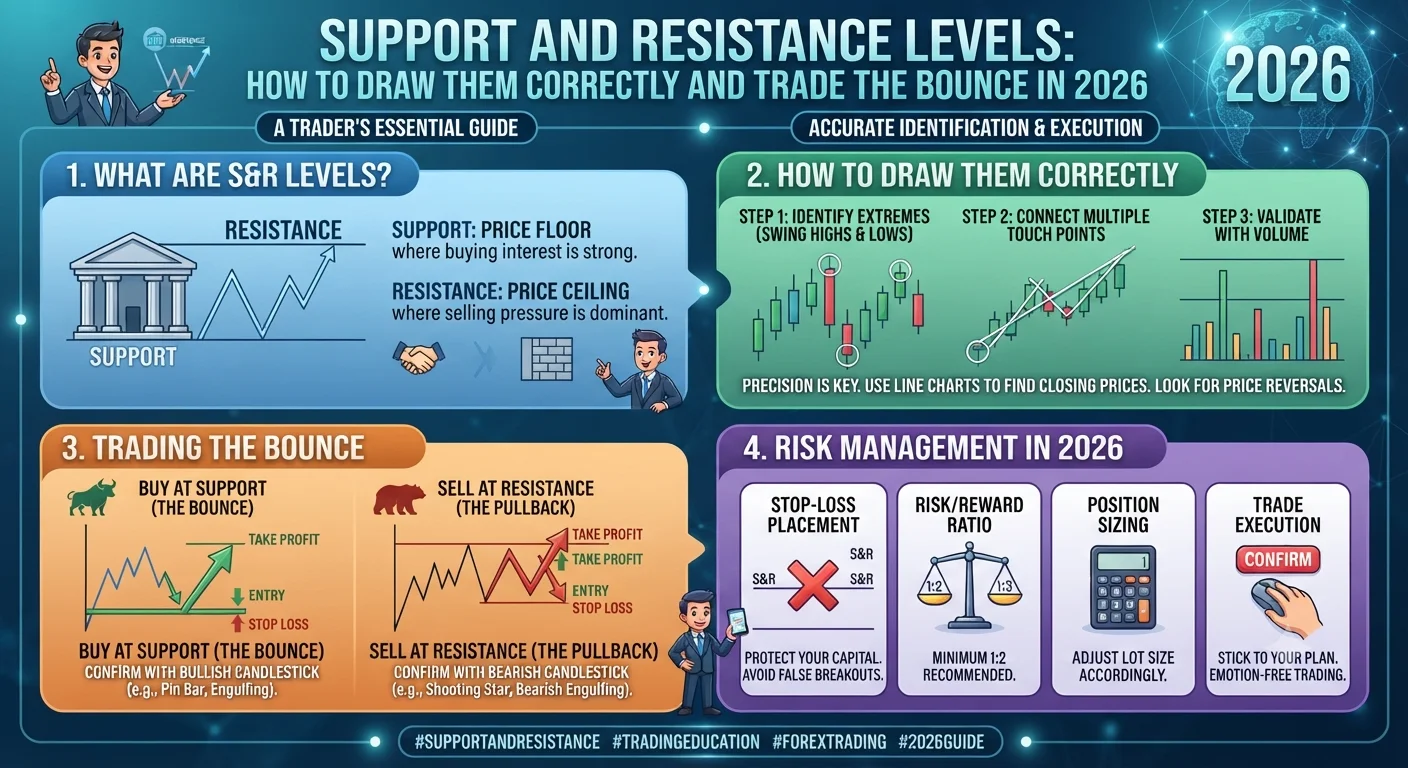
Support and resistance levels are horizontal price zones on a forex chart where buying or selling pressure has historically been strong enough to reverse or stall price movement. Support is a price floor where buyers step in to prevent further decline. Resistance is a price ceiling where sellers apply pressure to prevent further advances. In 2026, these levels remain the most universally used analytical tool among both retail and institutional traders because they directly reflect the collective memory of market participants at specific price points.
What Are Support and Resistance Levels in Forex?
Support and resistance are the two most fundamental concepts in all of technical analysis. They predate every indicator, oscillator, and algorithmic strategy ever developed, and they remain essential in 2026 precisely because they are based not on mathematical formulas but on human behavior and market psychology.
A support level is a price area where, historically, demand has been sufficient to halt a declining price and cause it to reverse upward. When price falls toward a support level, buyers who remember that price previously reversed from that zone place buy orders in anticipation of the same reaction. This concentration of buy orders creates genuine demand that props up price, often producing the expected bounce.
A resistance level is the opposite: a price area where supply has historically been sufficient to halt a rising price and cause it to reverse downward. Sellers who missed selling at a previous high place sell orders there in anticipation of the same rejection. This concentration of sell orders creates supply that caps price advances.
The crucial insight is that support and resistance levels work because enough traders believe they work and act on that belief simultaneously. They are self-fulfilling to a meaningful degree, particularly on higher timeframes where institutional traders, retail traders, algorithmic systems, and option writers all place orders around the same widely recognized levels.
In 2026, with artificial intelligence and algorithmic trading representing the majority of forex order flow, machine learning models trained on historical price data also tend to identify and react to the same major historical levels that human traders recognize. This convergence between human and algorithmic recognition makes well-established support and resistance levels more significant, not less, than they were in purely manual trading eras.
How to Identify Key Price Levels on Any Timeframe
- What Are Support and Resistance Levels in Forex?
- How to Identify Key Price Levels on Any Timeframe
- The Psychology Behind Support and Resistance Zones
- Trading the Bounce Versus Trading the Breakout: Which Is Safer?
- Using Multiple Timeframe Analysis to Confirm Support and Resistance Levels
- Key Takeaways on Support and Resistance Trading in 2026
Drawing support and resistance levels is a skill that improves with practice. The core principle is simple: look for price areas where the market has previously reversed direction multiple times, with each touch validating the level's significance.
Step 1: Start from the highest timeframe. Begin your support and resistance analysis on the monthly chart. Levels visible on the monthly chart represent years of price memory and carry the highest significance. Note any clear price clusters where the market reversed multiple times over a span of months or years. These become your most important macro-level reference zones.
Step 2: Move to the weekly chart. Add any additional significant levels visible on the weekly chart that do not already appear on the monthly analysis. Weekly levels represent months of market memory and are watched closely by institutional traders.
Step 3: Refine on the daily and 4-hour charts. Daily chart levels are the primary reference for most swing traders. On the 4-hour chart, you can see finer detail within the broader levels identified above, helping pinpoint entry zones more precisely.
Step 4: Draw zones, not lines. This is the most important practical refinement in 2026 technical analysis practice. Price does not reverse at a perfectly precise pip level. It reverses within a zone. A support zone might span 15 to 30 pips on EUR/USD. Drawing a zone rather than a single horizontal line prevents the common error of dismissing a valid level because price temporarily pierced the exact line before reversing. Use two parallel horizontal lines to bracket the zone rather than a single line.
Step 5: Identify significant touches. A level that has produced two reversals carries moderate significance. A level with three or more clear reversals is a major level that institutional traders are actively monitoring. The more times price has respected a level, the more orders are clustered around it for the next test.
The Psychology Behind Support and Resistance Zones
Understanding why support and resistance work requires understanding the psychology of three groups of traders who are always present in the market simultaneously.
Trapped longs are traders who bought at or near a resistance level and are now holding losing positions as price fell away from their entry. They are eager to break even and will sell when price returns to their entry level. This creates additional selling pressure at resistance, reinforcing the level.
Trapped shorts are traders who sold at or near a support level and are now holding losing short positions as price rose away. They will buy to cover their losses when price returns to their entry, reinforcing buying pressure at support.
Sideline traders are those who identified a key level, missed the initial trade, and are waiting for price to return to the same level to enter. When price revisits a known level, these traders add their orders to the cluster of stops and limits already present, reinforcing the concentration of order flow at the level.
Recommended Articles
 TECHNICAL ANALYSIS
 TECHNICAL ANALYSIS
 TECHNICAL ANALYSIS
 TECHNICAL ANALYSIS
These three groups collectively create what market microstructure researchers call a liquidity pool at established support and resistance zones. The concentration of orders from multiple trader types at the same price area is precisely what makes the level functional. When price approaches it, the accumulated orders in the zone produce a measurable reaction that appears as a bounce, consolidation, or breakout on the chart.
Trading the Bounce Versus Trading the Breakout: Which Is Safer?
Two primary trading strategies exist around support and resistance levels. Trading the bounce means entering in the direction of the expected reversal when price reaches the level, anticipating that the level will hold. Trading the breakout means entering in the direction of the break when price moves through a level convincingly, anticipating that the broken level will now function in reverse (former support becomes resistance, former resistance becomes support).
Trading the bounce is generally considered the safer approach for several reasons. First, the entry is at or near the support or resistance zone, providing a natural, structural stop loss location just beyond the zone boundary. If the level fails and price moves through it, the stop is hit at a clearly defined point. Second, the risk-reward is typically favorable because the stop is tight (just beyond the zone) while the target is the opposite side of the trading range or the next major level.
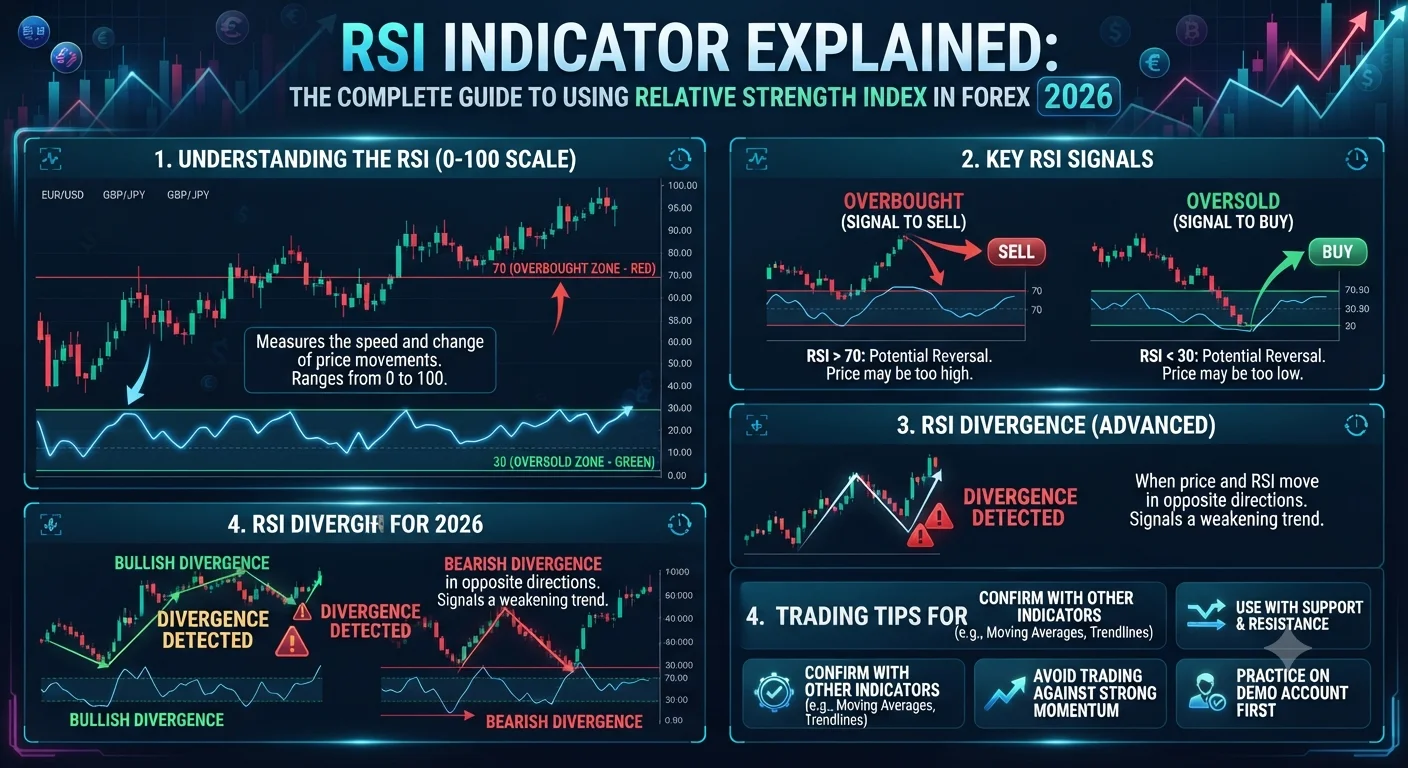
The key risk of bounce trading is false bounces where price appears to respect a level briefly before breaking through on the next attempt. To filter false bounces, require at least one of the following before entering: a clear reversal candlestick pattern at the level (hammer, engulfing, or pin bar), an RSI reading below 30 at support or above 70 at resistance, or a volume spike on the reversal candle confirming genuine order absorption.
Trading the breakout offers larger potential moves because a confirmed break of a major level often leads to accelerated directional movement as stop orders trigger and new trend participants enter. However, breakouts carry a higher false-signal rate. In 2026 analysis of EUR/USD on the 4-hour chart, approximately 55 to 65% of initial breakout attempts from established levels are false breakouts (also called stop hunts or liquidity grabs) that reverse back inside the range within one to three candles.
To filter false breakouts, wait for the close of a candle beyond the level (not just an intrabar wick), then wait for a retest of the broken level from the other side before entering. This retest entry is commonly called the pullback-to-breakout method, and it significantly improves breakout entry accuracy while sacrificing a small portion of the initial move.
Using Multiple Timeframe Analysis to Confirm Support and Resistance Levels
The concept of confluent levels is one of the most powerful tools in technical analysis. Confluence occurs when multiple independent technical factors point to the same price zone simultaneously.
A support level that appears on the weekly chart, coincides with a 61.8% Fibonacci retracement of the most recent major swing, and aligns with a round number (such as 1.0800 on EUR/USD) is a confluent level. Three independent technical factors all identify the same zone as significant. When price approaches this zone, the concentration of orders from traders using each of these three analytical methods simultaneously is far greater than for a level identified by only one method.
In practice, the workflow for multi-timeframe confirmation is as follows. Identify the major support or resistance level on the daily or weekly chart. Check whether a Fibonacci retracement level from the most relevant recent swing aligns with this zone. Check whether the level coincides with a round number or a previous major swing high or low from a year or more ago. Check the 4-hour RSI for overbought or oversold conditions as price approaches. If three or more of these factors align at the same price zone, the setup is treated as high-confluence and given a higher position size within the risk management framework, typically up to 1.5 times the normal risk allocation.
This systematic approach to confluence transforms support and resistance from a simple visual tool into a probabilistic filter that consistently identifies the price zones with the highest likelihood of producing meaningful market reactions.
Key Takeaways on Support and Resistance Trading in 2026
Support and resistance levels are the most universally recognized analytical framework in forex trading, used simultaneously by retail traders, institutional desks, and the algorithmic systems that now dominate market volume. Drawing zones rather than lines, starting analysis from the highest timeframe down, and requiring candlestick confirmation before entry are the three practices that separate consistently profitable support and resistance traders from those who treat levels as mechanical entry triggers without context. Combining multi-timeframe analysis with Fibonacci confluence and round-number alignment creates the highest-quality trading setups available in technical analysis.
Financial Disclaimer: This article is intended for educational purposes only and does not constitute financial advice. All trading involves risk of loss. Please conduct your own research and consult a licensed financial professional.