Quick Answer
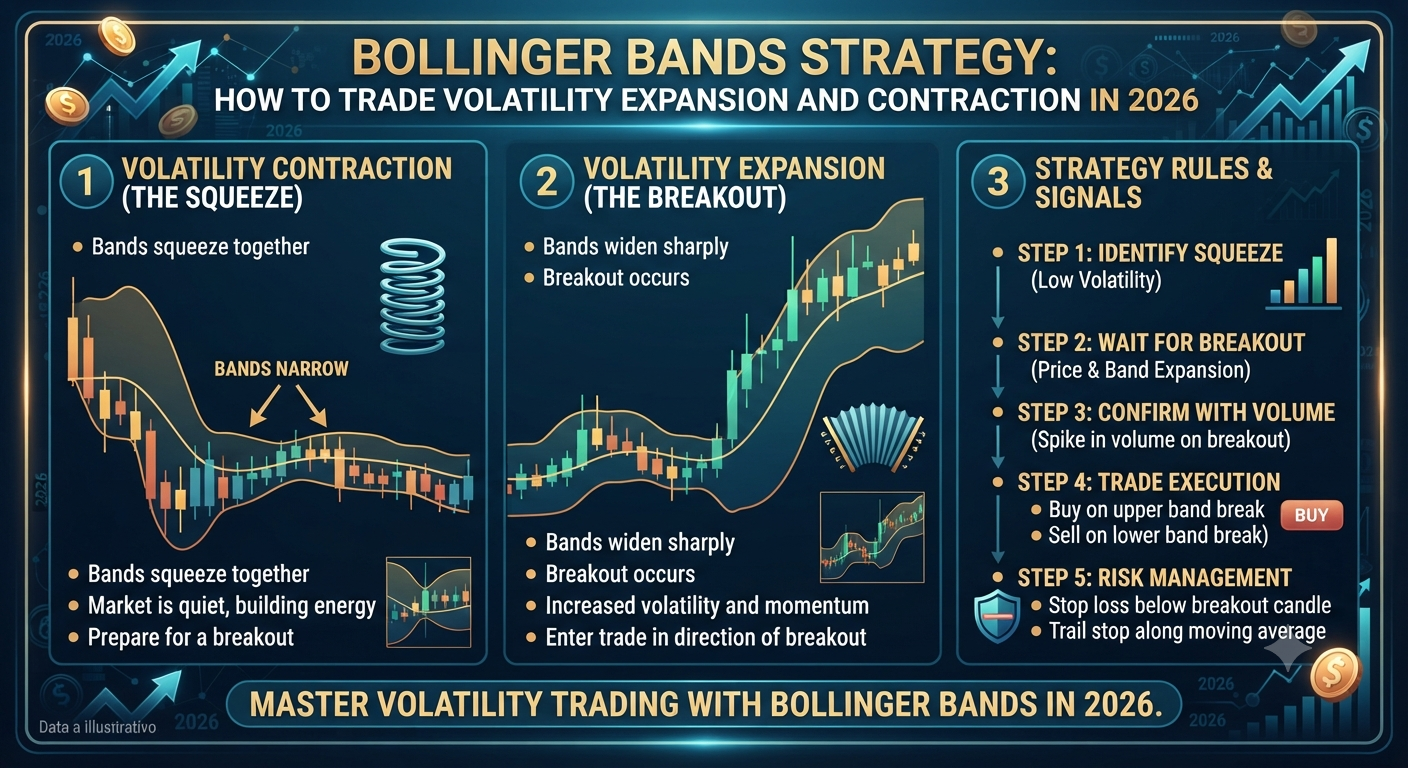
Bollinger Bands is a volatility indicator developed by John Bollinger in the 1980s consisting of three lines plotted around price: a middle band (20-period Simple Moving Average), an upper band (2 standard deviations above the middle band), and a lower band (2 standard deviations below the middle band). The distance between the upper and lower bands expands during high-volatility periods and contracts during low-volatility periods, creating a visual map of the market's volatility cycle. In 2026, Bollinger Bands are used for three primary strategies: the Bollinger Squeeze (identifying breakout setups from low-volatility contractions), band walking (confirming strong trend momentum), and mean reversion trading at the extreme bands.
What Are Bollinger Bands and How Are They Calculated?
- Quick Answer
- What Are Bollinger Bands and How Are They Calculated?
- The Bollinger Squeeze: Identifying Low-Volatility Breakout Setups
- Trading the Bands: Upper, Lower, and Middle Band Signals
- Bollinger Band Walking: A Trend Continuation Signal Explained
- Combining Bollinger Bands with RSI for High-Probability Entries
- Best Settings and Timeframes for Bollinger Bands in Forex Trading
- Key Takeaways on Bollinger Bands Trading in 2026
John Bollinger developed Bollinger Bands in the early 1980s while working as a financial analyst and television commentator. He published the complete methodology in his 2001 book Bollinger on Bollinger Bands, which remains the definitive reference for the indicator in 2026.
The three components of Bollinger Bands are calculated as follows.
The middle band is a 20-period Simple Moving Average of closing prices. It represents the medium-term average price and functions as a dynamic equilibrium line around which price oscillates.
The upper band is calculated by adding two standard deviations of the 20-period closing price data to the middle band. Standard deviation measures the dispersion of price around its average. Adding two standard deviations means that statistically, approximately 95% of all price data should fall within the upper and lower bands when price is normally distributed.
The lower band is calculated by subtracting two standard deviations from the middle band.
The key insight that makes Bollinger Bands useful is their adaptive nature. When price volatility increases (larger candles, bigger swings), the standard deviation calculation grows and the bands expand outward automatically. When volatility decreases (smaller candles, tighter ranges), the standard deviation shrinks and the bands contract inward. This self-adjusting mechanism means Bollinger Bands always reflect current volatility conditions rather than requiring manual parameter adjustment as market conditions change.
The standard settings of 20 periods and 2 standard deviations are optimal for most swing trading applications on the 4-hour and daily charts and are the settings John Bollinger himself recommends as the starting point. For scalping on shorter timeframes, some traders use a 10-period middle band. For longer-term position trading, a 50-period middle band is sometimes used. The 2 standard deviation setting is rarely changed because it maintains the statistical property of containing approximately 95% of price action within the bands.
In 2026, Bollinger Bands are available as a standard built-in indicator on all major platforms including MetaTrader 4, MetaTrader 5, TradingView, and cTrader, requiring no custom installation.
The Bollinger Squeeze: Identifying Low-Volatility Breakout Setups
The Bollinger Squeeze is the most widely recognized and consistently reliable Bollinger Bands trading pattern. It is based on the empirical observation that periods of low volatility (when the bands contract tightly together) are consistently followed by periods of high volatility and strong directional movement (when the bands expand rapidly).
This volatility cycle behavior reflects a fundamental characteristic of financial markets: periods of consolidation and equilibrium are followed by periods of imbalance and directional resolution. When buyers and sellers are in temporary balance, the range of price movement contracts. When the balance is disrupted by new information, a buildup of orders, or a catalyst that shifts sentiment, price breaks out of the equilibrium zone with increased momentum.
The Bollinger Squeeze is visually identified by looking for periods when the upper and lower bands come unusually close together relative to their recent historical width. The Bandwidth indicator, which measures the distance between the upper and lower bands as a percentage of the middle band, quantifies this visually and allows traders to identify when bandwidth is at multi-month lows, indicating a particularly tight squeeze with potentially significant breakout potential.
On the 4-hour EUR/USD chart throughout 2025 and into 2026, Bollinger Squeezes preceding major directional breaks of 100 pips or more have occurred approximately once every three to four weeks, providing a regular rhythm of high-probability breakout setups for traders who monitor the indicator.
Trading the Bollinger Squeeze: Identify a squeeze by observing several consecutive candles where the price is contained in a narrow range and the bands are noticeably closer together than their recent average. Do not enter during the squeeze. The direction of the eventual breakout is unknown until it begins.
Place a Buy Stop order slightly above the squeeze range high and a Sell Stop order slightly below the squeeze range low in an OCO (One Cancels Other) configuration. When the breakout occurs, one order executes and the other is cancelled. Confirm the breakout direction with a candle close beyond the band before trusting it. Stop loss is placed on the opposite side of the squeeze range. Target is the width of the squeeze range projected from the breakout point, or the next major structural level, whichever is closer.
The single most important discipline in squeeze trading is avoiding the common mistake of entering before the breakout occurs based on anticipation of which direction the break will go. The squeeze itself provides no directional information. Patience until the actual break and confirmation is what separates profitable squeeze traders from those who repeatedly predict the wrong direction.
Trading the Bands: Upper, Lower, and Middle Band Signals
Beyond the squeeze setup, each of the three Bollinger Bands provides specific analytical information about current market conditions.
Upper Band Signals: When price touches or briefly exceeds the upper band in a non-trending, range-bound market, it signals that price has moved two standard deviations above its 20-period average, placing it in statistically overbought territory for that volatility environment. In a range-bound context, this is a potential short entry signal, with a stop above the recent swing high and a target at the middle band or lower band.
However, in a trending market, price touching the upper band repeatedly is not a short signal. It is a sign of strong bullish momentum. Recognizing the difference between a range-bound market and a trending market before applying upper band signals is critical and is the most common error made by traders new to Bollinger Bands analysis.
Lower Band Signals: The mirror of the upper band. In a range-bound market, price touching the lower band signals potential statistical oversold conditions and a possible long entry. In a downtrend, repeated lower band touches confirm strong bearish momentum rather than signaling a long opportunity.
Recommended Articles
 TECHNICAL ANALYSIS
 TECHNICAL ANALYSIS
 TECHNICAL ANALYSIS
 TECHNICAL ANALYSIS
Middle Band Signals: The middle band (20-period SMA) functions as a dynamic support and resistance level and as a trend direction filter. In an uptrend, price repeatedly pulls back to the middle band and finds support, then bounces back toward the upper band. Trading long at the middle band during these pullbacks in confirmed uptrends is a consistently applicable strategy. In a downtrend, rallies to the middle band are rejected and price returns to the lower band, providing short entry opportunities at the middle band.
The middle band signal rule is simple: in a confirmed uptrend (price above the middle band, middle band sloping upward), buy pullbacks to the middle band. In a confirmed downtrend (price below the middle band, middle band sloping downward), sell rallies to the middle band. This approach keeps trades aligned with trend direction rather than fighting it.
Bollinger Band Walking: A Trend Continuation Signal Explained
Bollinger Band walking is the phenomenon where price hugs the upper or lower band for an extended period during a strong trend, producing a series of candles that consistently close at or near the upper band (in an uptrend) or lower band (in a downtrend).
This behavior is counterintuitive to traders who interpret upper band touches as sell signals. In reality, when price is walking the upper band with the middle band sloping steeply upward and successive candles closing near or above the upper band, it indicates extraordinarily strong bullish momentum. The market is moving so strongly in one direction that even the 2-standard-deviation upper boundary cannot contain the price. This is a trend continuation signal, not an overbought warning.
Bollinger himself addressed this directly in his published work, emphasizing that touching a band alone is not a buy or sell signal. The statistical concept of overbought and oversold only applies in non-trending markets. In trending markets, bands should be viewed as dynamic channels rather than reversal signals.
In 2026, band walking has been observed on GBP/USD and USD/JPY during periods following significant central bank divergence events. The March 2026 BOJ rate decision, which surprised markets by maintaining rates lower than expected despite rising Japanese inflation, produced a USD/JPY rally where price walked the upper Bollinger Band on the 4-hour chart for eleven consecutive candles, generating over 200 pips of directional movement for traders who recognized the band walking pattern and held their long positions rather than selling at the first upper band touch.
The entry strategy for band walking in real time involves entering on the first clear pullback to the middle band after the band walking has established itself with at least three consecutive upper (or lower) band closes. The pullback to the middle band is the entry, stop below the pullback low (for long trades), and target the resumption of band walking to new highs.
Combining Bollinger Bands with RSI for High-Probability Entries
Bollinger Bands and RSI are complementary tools that address different dimensions of price behavior. Bollinger Bands measure volatility and relative price position. RSI measures momentum and overbought or oversold conditions. When both agree at the same price zone, the probability of a meaningful reaction increases significantly.
The most reliable combination setup is the Bollinger Band lower band touch confirmed by RSI oversold reading (below 30) in a range-bound or uptrending market, used as a long entry signal. This occurs when price reaches the statistical extreme of its recent volatility range (lower band touch) and momentum confirms that selling pressure is at an extreme (RSI below 30), creating double confirmation for a potential bounce from a statistically significant level.
The entry rule for this combination: price must close at or below the lower band with RSI simultaneously below 30. The entry is at the close of the next candle after these conditions are met, or on a limit order at the lower band level. Stop loss is placed 10 to 20 pips below the most recent swing low. Target is the middle band as the primary objective, with the upper band as a secondary extended target.
The same logic applies in reverse for short entries in downtrends or ranges: upper band touch with RSI above 70 is a short entry signal targeting the middle band.
The filter that converts this from a good setup to a high-probability one is the overall market context. This combination works well in clearly range-bound markets and during pullbacks in confirmed uptrends. It should not be applied in strong downtrends where lower band touches indicate momentum continuation rather than reversal opportunities. Always assess whether the daily chart trend direction is consistent with the entry direction before applying any mean reversion signal from the Bollinger Bands and RSI combination.
Best Settings and Timeframes for Bollinger Bands in Forex Trading
The standard 20-period, 2-standard-deviation settings work well across the 4-hour and daily charts for swing trading applications. For other timeframes and purposes, the following adjustments are used by experienced traders in 2026.
For scalping on the 5-minute chart, a 10-period middle band with 2 standard deviations produces faster reactions that suit the rapid decision requirements of short-term trading. The squeeze pattern is particularly useful on the 5-minute chart for identifying high-momentum breakouts during the London open, when the transition from Asian session low-volatility to London session high-volatility frequently produces clean Bollinger Squeeze breakouts.
For day trading on the 1-hour chart, the standard 20-period setting is appropriate. The middle band on the 1-hour chart represents 20 hours of average price behavior, providing meaningful trend context for intraday directional trades.
For position trading on the weekly chart, a 20-period setting represents 20 weeks of price behavior, making the bands wide enough to contain multi-month swings. The squeeze pattern on the weekly chart is particularly significant because weekly squeezes precede the largest and most sustained directional moves in any currency pair's annual price cycle.
Key Takeaways on Bollinger Bands Trading in 2026
Bollinger Bands are an adaptive volatility indicator that automatically adjusts to current market conditions, expanding during high-volatility periods and contracting during low-volatility periods. The Bollinger Squeeze identifies potential high-momentum breakout setups from periods of unusually low volatility. Band walking confirms strong trend momentum and should not be interpreted as an overbought or oversold signal in trending markets. The middle band functions as dynamic support and resistance in trending markets, providing consistent pullback entry opportunities. Combining lower band touches with RSI oversold readings and upper band touches with RSI overbought readings creates high-confluence mean reversion signals in range-bound markets. Always assess overall market structure and trend context before applying any Bollinger Bands signal to ensure alignment with the dominant directional bias.
Financial Disclaimer: This content is for educational purposes only and does not constitute financial advice. Forex trading involves significant risk of loss. Always conduct independent research and consult a qualified financial professional before making trading decisions.