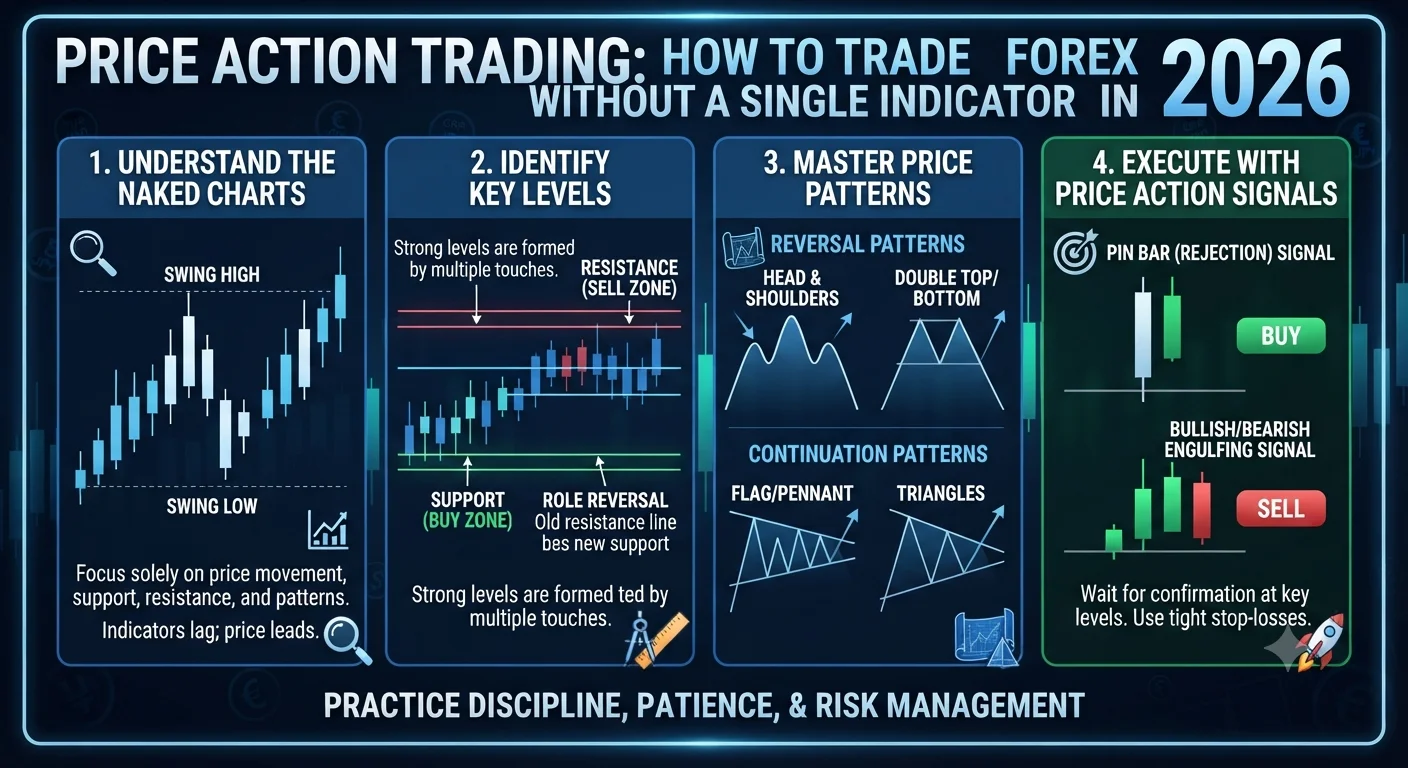
Price action trading is the practice of making all trading decisions based solely on the movement of price on a raw, uncluttered chart, without the use of lagging technical indicators such as RSI, MACD, or moving averages. Instead, price action traders read the story told directly by candlestick patterns, market structure, trend direction, and key support and resistance levels. In 2026, price action trading is the preferred methodology of a large proportion of consistently profitable retail traders and virtually all professional trading desks, because it develops a deep understanding of market behavior that no indicator can replicate or replace.
What Is Price Action Trading and Why Do Professionals Prefer It?
Price action trading is built on a single foundational principle: price is the ultimate leading indicator. Every other technical indicator in existence, from the simplest moving average to the most complex multi-variable oscillator, is derived from price. These indicators take raw price data and transform it through mathematical formulas to produce a visual output that is, by definition, a lagging reflection of what price has already done.
Price action, by contrast, is the raw data itself. A trader reading price action directly is reading the most current, unprocessed information available on any chart. There is no lag, no smoothing, and no formula-induced distortion between what the market is doing and what the price action trader perceives.
This is why professional trading desks at investment banks, hedge funds, and proprietary trading firms have historically favored price action-based analysis as their primary framework. Institutional traders managing positions worth tens or hundreds of millions of dollars cannot afford the lag of indicator-based signals. They read price structure directly to identify where the most significant concentration of orders exists, where trends are likely to resume or reverse, and where risk is lowest relative to potential reward.
In 2026, with algorithmic trading representing the majority of forex market volume, price action has actually become more relevant rather than less. The algorithms driving most institutional order flow are designed around price structure, key levels, and liquidity dynamics, which are all concepts rooted in price action theory. A retail trader who understands price action is effectively reading the same framework that the algorithms operate within.
A secondary advantage of price action trading is its psychological clarity. When a trader depends on five indicators simultaneously and receives conflicting signals, paralysis and confusion frequently result. A price action trader using only the raw chart and a few key structural levels operates with a clarity of decision-making that indicator-dependent traders rarely experience.
Identifying Trend, Range, and Breakout Market Structures
- What Is Price Action Trading and Why Do Professionals Prefer It?
- Identifying Trend, Range, and Breakout Market Structures
- Inside Bars, Pin Bars, and Engulfing Patterns: The Core Signals
- How to Trade Price Action at Key Market Structure Levels
- Building a Pure Price Action Trading System from Scratch
- Key Takeaways on Price Action Trading in 2026
The first task of every price action trading session is identifying which of three market conditions currently exists on the chart being analyzed. Every market, at any given moment on any timeframe, is in one of three structural states: trend, range, or breakout. Each requires a fundamentally different trading approach.
Trending Market Structure
A trending market is defined by a series of directional swing points. In an uptrend, price creates higher swing highs and higher swing lows, meaning each new peak exceeds the previous peak and each new trough is higher than the previous trough. In a downtrend, price creates lower swing highs and lower swing lows, with each peak lower than the last and each trough falling below the previous one.
Identifying trend structure requires no indicator whatsoever. A trader draws a line connecting successive swing lows in an uptrend or successive swing highs in a downtrend and observes whether price is making consistent directional progress. When it is, the appropriate price action strategy is trend following: looking for pullbacks to key structural levels where the trend is likely to resume, and entering in the direction of the established trend.
The most important rule in trending market structure is to never fight the trend. The phrase "the trend is your friend" is among the most cliched in trading, but the statistical reality behind it is robust. Academic research consistently demonstrates that trend-following strategies applied across major forex pairs over multi-year periods generate positive expected value, while counter-trend strategies require exceptional timing and generate lower average returns.
Range-Bound Market Structure
A ranging market oscillates between two horizontal boundaries: a resistance zone above and a support zone below. Price tests the upper boundary, fails to break through, falls back toward the lower boundary, fails to break lower, and reverses again toward resistance. This behavior continues until a breakout event disrupts the equilibrium.
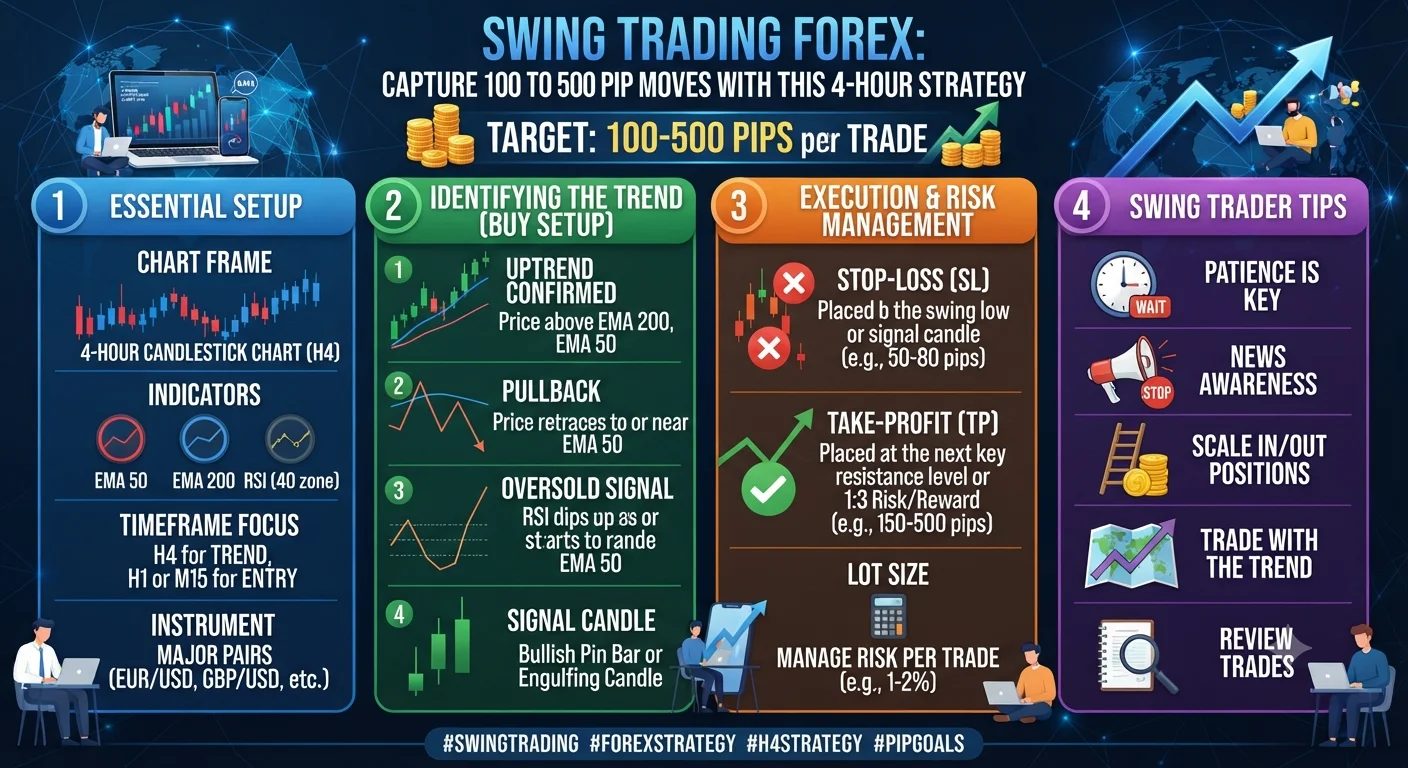
- Swing Trading Forex: Capture 100 to 500 Pip Moves with This 4-Hour Strategy
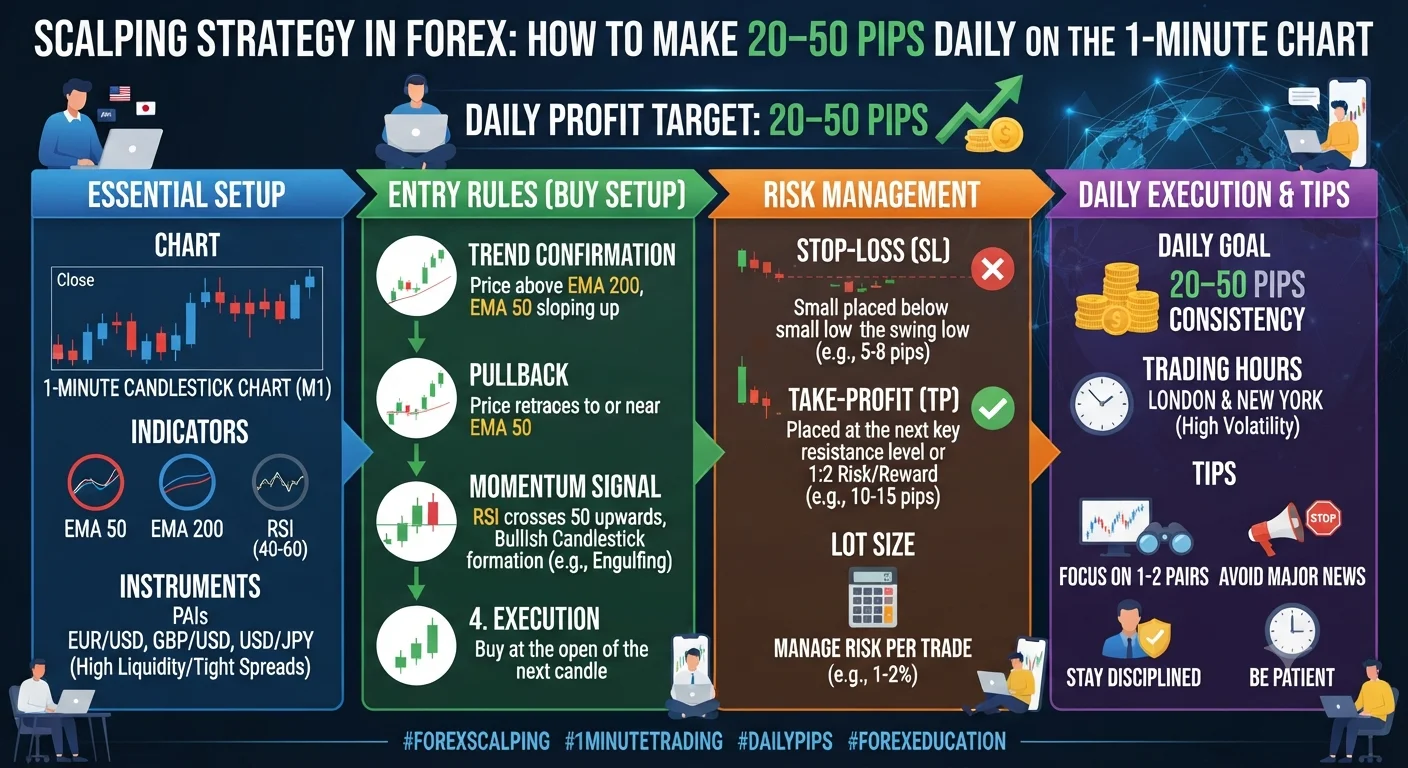
- Scalping Strategy in Forex: How to Make 20–50 Pips Daily on the 1-Minute Chart
Range-bound market conditions account for approximately 60 to 70% of all forex market time, according to studies of major pair behavior across multi-year periods. This means that trend-following strategies, applied indiscriminately, lose money the majority of the time because the market is ranging rather than trending when the signals are generated.
In a ranging market, the price action strategy shifts to range trading: buying near the lower boundary of the range when price shows rejection signals (lower wicks, bullish candle closes) and selling near the upper boundary when rejection signals appear (upper wicks, bearish candle closes). Targets are set toward the opposite boundary, and the strategy is abandoned when price breaks cleanly through either boundary.
Breakout Market Structure
A breakout occurs when price moves decisively through a previously established support or resistance boundary, whether from a range, a chart pattern, or a key historical level. Genuine breakouts initiate new trending phases and offer some of the highest momentum trading opportunities in the forex market.
The challenge of breakout identification is distinguishing genuine breakouts from false breakouts. In 2026, the most reliable breakout confirmation requires three elements: a candle close beyond the boundary (not merely a wick pierce), a subsequent retest of the broken level from the other side (former resistance tested as new support, or vice versa), and increasing directional momentum on the candles immediately following the break. When all three conditions are present, the probability of the breakout initiating a sustained new trend is meaningfully higher than when any one condition is absent.
Inside Bars, Pin Bars, and Engulfing Patterns: The Core Signals
Price action trading relies on a small set of high-reliability candlestick formations to generate specific entry signals. These are not the full library of candlestick patterns covered in Day 1's technical analysis articles, but rather the three most universally recognized and consistently reliable price action signals used by professional traders worldwide.
The Pin Bar
The pin bar (short for Pinocchio bar, named for its long nose that probes beyond legitimate price structure) is a single candle with a very long wick on one end and a small body at the opposite end, with little to no wick on the body side. A bullish pin bar has a long lower wick that signals price was rejected firmly at lower levels and closed near its session high. A bearish pin bar has a long upper wick, signaling rejection of higher prices with a close near the session low.
Recommended Articles
 TRADING STRATEGIES
 TRADING STRATEGIES
 TRADING STRATEGIES
 TRADING STRATEGIES
The pin bar is one of the most visually obvious and psychologically intuitive price action signals. The long wick represents a failed attempt to push price in one direction: sellers drove price down aggressively but buyers reversed the move completely before the candle closed, or buyers pushed price up but sellers overwhelmed them and closed the candle near its lows. This rejected move tells a clear story about where genuine supply or demand exists.
Pin bars carry the most significance when they form at key structural levels, specifically at previously established support or resistance zones, at round-number price levels, or at the boundaries of chart patterns. A pin bar appearing in the middle of open price action with no structural context carries minimal analytical significance and should be ignored.
The Inside Bar
An inside bar is a two-candle pattern where the second candle's high and low are entirely contained within the range of the first candle (called the mother bar). The inside bar represents a period of market consolidation and indecision following the preceding directional move. It signals that neither buyers nor sellers have been able to push price beyond the boundaries established by the mother bar.
Inside bars are most powerful as continuation signals within established trends. In an uptrend, an inside bar forming after a directional bull candle signals a brief pause before the trend resumes. A breakout above the mother bar's high on a subsequent candle confirms the continuation and provides the entry signal for a long trade. The stop loss is placed below the mother bar's low.
Inside bars also function as reversal signals when they form at key structural levels at the end of a trend leg. In this context, the inside bar consolidation at a support or resistance level signals that the prevailing move is exhausting and that the next directional break of the mother bar's boundaries will reveal the new direction.
The Engulfing Pattern
The engulfing pattern (covered in the candlestick patterns article in Day 1 but worth contextualizing within pure price action practice) is a two-candle pattern where the second candle's body completely overtakes the body of the previous candle in the opposite direction. A bullish engulfing following a downward move, where a large green candle completely covers the previous red candle's body, signals a decisive shift from bearish to bullish sentiment within that single period.
In price action trading, the engulfing pattern is valued for the clarity of its signal. There is no ambiguity in interpretation: sellers were in control during the first candle, and buyers completely overwhelmed them during the second candle. The question for the price action trader is whether the structural context justifies acting on that signal: is the engulfing at a key level? Is it aligned with the higher timeframe trend? Does the subsequent candle confirm the direction?
How to Trade Price Action at Key Market Structure Levels
The intersection of candlestick price action signals with key market structure levels is where the highest-probability setups in pure price action trading are found. This intersection is what experienced price action traders spend their analysis time identifying, and it is what gives the approach its genuine edge.
The workflow is always top-down: begin with the weekly chart to identify the major trend and the most significant structural levels. Move to the daily chart to add detail, identifying the swing highs and lows that define the current medium-term market structure. Move to the 4-hour chart for potential trade entry zones and to look for price action signals forming at the daily levels already identified.
When a pin bar, inside bar, or engulfing pattern forms on the 4-hour chart precisely at a level that was identified as significant on the daily or weekly chart, the setup carries the structural authority of those higher timeframes combined with the entry precision of the 4-hour timeframe. This is the core of professional price action trading methodology.
Entry is taken at the close of the signal candle or at a limit order slightly inside the signal candle's range for better risk-reward. The stop loss is placed beyond the extremity of the signal candle (below the pin bar's wick low for bullish pins, above the wick high for bearish pins, beyond the mother bar's extremity for inside bars). The target is the next significant structural level in the direction of the trade, which on 4-hour setups aligned with daily structure is often 150 to 350 pips distant, creating natural risk-reward ratios of 1:2 to 1:5.
Building a Pure Price Action Trading System from Scratch
A complete price action trading system requires four defined components: a market selection criteria, a trend and structure identification process, a signal criteria definition, and an entry, stop, and target framework.
Market selection: Choose two to four major currency pairs as your primary focus. EUR/USD, GBP/USD, USD/JPY, and AUD/USD offer the cleanest price action due to their high liquidity, tight spreads, and consistent technical behavior. Avoid exotic pairs and minor pairs with wide spreads until your price action reading skills are fully developed.
Structure identification process: Every Sunday before the trading week begins, perform top-down analysis on all monitored pairs. On the weekly and daily charts, identify and mark the major support and resistance zones, the current swing high and swing low, and the prevailing trend direction. These marked zones become your price action monitoring points for the week.
Signal criteria definition: Define precisely which signals you will trade and which you will not. A clear signal policy might read as follows: trade bullish pin bars that form at daily support in a daily uptrend, where the pin bar's wick is at least two times the length of its body, and the candle closes in the upper third of its range. Trade bullish engulfing patterns at weekly support levels only when the engulfing candle closes above the midpoint of the previous bearish candle's body. Be this specific. Vague signal criteria produce inconsistent trading decisions.
Entry, stop, and target framework: Entry at the close of the qualifying signal candle or on a limit order at a defined location within the signal. Stop below the lowest wick of the signal candle for longs (or above the highest wick for shorts) with a maximum stop distance defined by your risk management rules. Target at the next significant structural level on the same timeframe as the signal, with a minimum required risk-reward of 1:2 before any trade is taken.
Document all four components in your trading plan document before the system goes live. Every trade placed must be traceable to a specific rule within the plan. Any trade that cannot be explained by the plan is a discretionary impulse and should not be placed.
Key Takeaways on Price Action Trading in 2026
Price action trading removes the lag and complexity of indicator-based approaches in favor of direct reading of the market's own language: candlestick patterns, market structure, trend direction, and key price levels. The three core signals, pin bars, inside bars, and engulfing patterns, provide clear, visually intuitive entry triggers that are most powerful when they form at key structural levels identified through top-down multi-timeframe analysis. Building a complete system requires precisely defined market selection, structure identification, signal criteria, and trade management rules. Practice identifying each signal type on historical charts before trading live, and maintain a rigorous trading journal from the first day of practice to build the pattern recognition that transforms raw chart reading into genuine analytical skill.
Financial Disclaimer: This content is for educational purposes only and does not constitute financial advice. Forex and CFD trading carries significant risk of loss. Always seek qualified financial advice before making any investment decisions.