Quick Answer
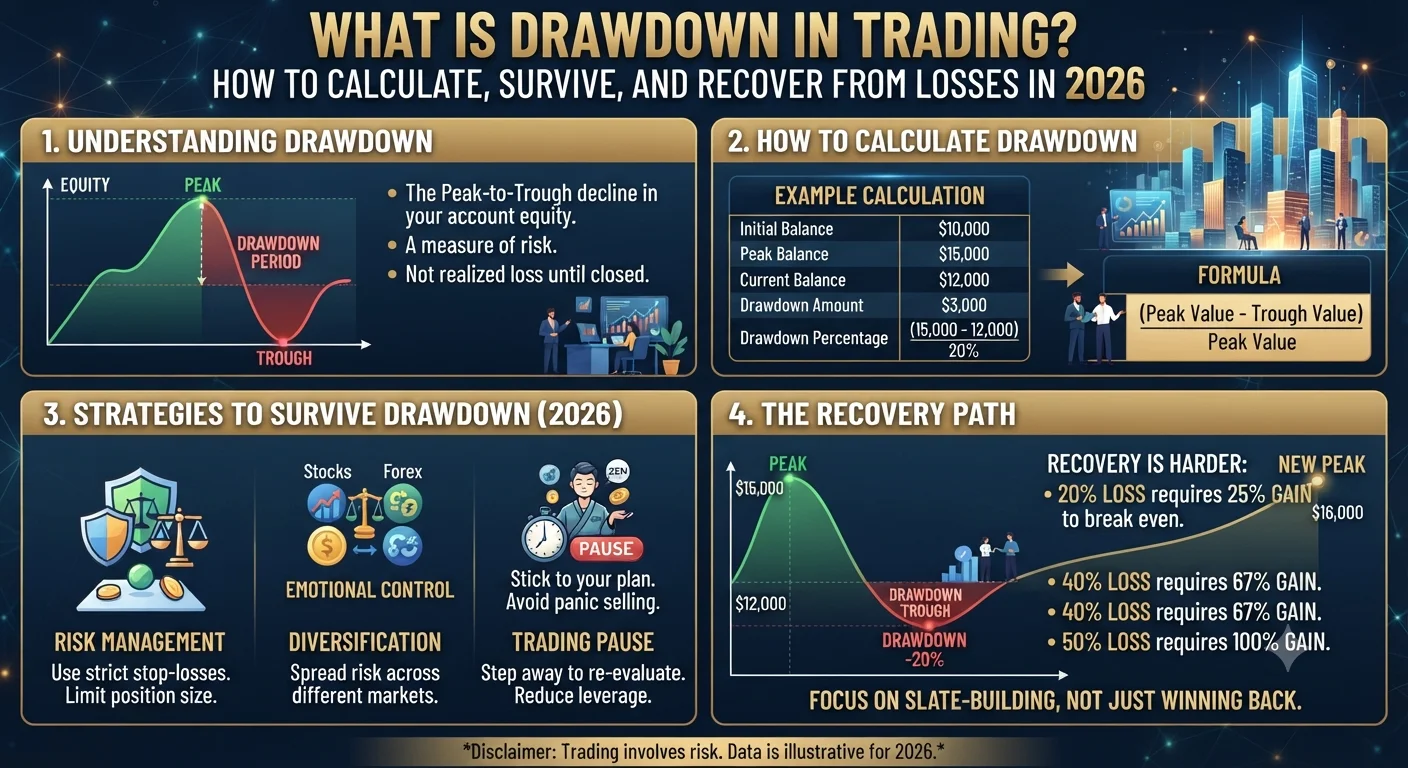
Drawdown in trading is the peak-to-trough decline in an account's value during a specific period, expressed as a percentage. If a trading account reaches a peak equity of $10,000 and then falls to $7,500 before recovering, the drawdown is 25%. Maximum drawdown (MDD) measures the largest peak-to-trough decline experienced over the entire trading history. Drawdown is the most critical risk metric used by professional fund managers, prop trading firms, and institutional investors to assess a trading strategy's risk profile, because it reveals not just average performance but the worst-case scenario a strategy has historically produced.
What Is Drawdown and Why Is It the Most Critical Metric in Trading?
- Quick Answer
- What Is Drawdown and Why Is It the Most Critical Metric in Trading?
- Maximum Drawdown Versus Average Drawdown: Key Differences Explained
- The Mathematical Reality of Recovering from a 50% Drawdown
- Drawdown Limits: How Professional Hedge Funds Manage Risk
- How to Build a Drawdown Recovery Plan for Your Trading Account
- Key Takeaways on Trading Drawdown in 2026
Most traders evaluate their performance primarily through the lens of profit: how much did I make this month? What is my win rate? What is my average return? These are useful metrics, but they are incomplete without understanding the drawdown profile that accompanied those returns.
Drawdown answers a fundamentally different question: what is the worst sequence of losses that this strategy or trader has experienced, and how long did it take to recover? This question matters enormously for several reasons.
First, drawdown determines psychological sustainability. A trading strategy that produces 30% annual returns but passes through a 50% drawdown at some point during the year is essentially impossible for most traders to continue operating through. The psychological pressure of seeing half the account value erased, even temporarily, causes most traders to abandon the strategy at or near the bottom of the drawdown, locking in the loss and missing the subsequent recovery. A strategy that produces 20% annual returns through a maximum 15% drawdown is far more psychologically sustainable and will be adhered to consistently.
Second, drawdown determines capital sufficiency. A trader who begins with $10,000 and experiences a 60% drawdown sees the account fall to $4,000. The mathematical requirement to recover from that point is a 150% return on the remaining capital just to reach breakeven. As drawdowns deepen, the recovery requirement grows exponentially, not linearly.
Third, drawdown determines whether a strategy can survive long enough to prove its edge. All strategies experience losing periods. The question is whether the account has enough capital remaining after the drawdown to continue trading and allow the statistical edge to manifest over a sufficient sample of trades. A trader who blows the account during a drawdown never gets to see the strategy recover.
For these reasons, drawdown is the metric that professional traders monitor most vigilantly and that risk management frameworks are specifically designed to limit.
Maximum Drawdown Versus Average Drawdown: Key Differences Explained
Two distinct drawdown metrics provide complementary information about a trading strategy's risk profile.
Maximum drawdown (MDD) is the single largest peak-to-trough decline ever experienced in the account's history. It represents the worst-case scenario that has actually occurred. If a strategy has been running for three years and the single worst losing sequence reduced the account from $20,000 to $13,000, the maximum drawdown is 35%. Maximum drawdown is the primary metric used by hedge funds, prop firms, and investors evaluating a strategy because it reveals the historical floor of the strategy's performance.
Average drawdown is the mean of all individual drawdown periods across the strategy's history. A strategy might have a maximum drawdown of 35% but an average drawdown of only 8%, indicating that the severe 35% drawdown was an outlier event and typical losing sequences are much less severe. Conversely, a strategy with a maximum drawdown of 20% but an average drawdown of 16% is consistently operating near its maximum losing potential, indicating high ongoing risk regardless of the more moderate-looking MDD figure.
The practical use of both metrics together is in expectation setting. Before trading any strategy live, calculating both the MDD and average drawdown from backtest or demo trading data gives you a realistic picture of what equity curve behavior to expect. If you know from historical data that your strategy experiences an average drawdown of 8% and a maximum drawdown of 22%, you can size your account appropriately (ensuring you have sufficient capital to survive a 22% drawdown without falling below your minimum viable trading capital) and set your psychological expectations accordingly.
In 2026, the top prop trading firms including FTMO, The5%ers, and FundedNext all use maximum drawdown as the primary challenge criterion, with typical maximum drawdown limits of 8% to 12% of the funded account size. Exceeding this limit results in the trader losing their funded account, which illustrates why professional traders treat MDD as the most mission-critical risk parameter in their operation.
The Mathematical Reality of Recovering from a 50% Drawdown
The mathematics of drawdown recovery is one of the most important and counterintuitive concepts in trading, and understanding it viscerally is often what separates traders who practice disciplined risk management from those who do not.
The recovery percentage required to return to peak equity after a drawdown is not equal to the drawdown percentage. It is always larger, and as drawdowns deepen, the required recovery grows exponentially.
A 10% drawdown requires an 11.1% return on remaining capital to recover. A 20% drawdown requires a 25% return to recover. A 30% drawdown requires a 42.9% return to recover. A 40% drawdown requires a 66.7% return to recover. A 50% drawdown requires a 100% return to recover. A 75% drawdown requires a 300% return to recover. A 90% drawdown requires a 900% return to recover.
The 50% level is the most commonly cited because it represents the mathematical point at which a strategy must double the remaining capital just to break even, and it is the drawdown level at which most retail traders effectively abandon trading permanently. Reaching a 50% drawdown is rarely the result of a single catastrophic trade (though overleveraging can produce this). More commonly, it results from a series of poor risk management decisions across multiple trades during a losing streak: not respecting stop losses, increasing position size in an attempt to recover losses, and continuing to trade when the daily or weekly loss limit should have stopped activity.
Recommended Articles
 RISK MANAGEMENT
The mathematical case for keeping maximum drawdown below 20% is overwhelming. At 20% drawdown, the account needs a 25% recovery, which is achievable within a few months with a working strategy. At 50%, the required 100% return may take years and requires the strategy to perform at peak level with no further drawdowns during the recovery period, an expectation that is rarely met.
Drawdown Limits: How Professional Hedge Funds Manage Risk
Professional investment managers apply systematic drawdown limits as hard rules that trigger automatic responses when breached, removing emotional decision-making from the risk management process.
The industry standard maximum drawdown limit for systematic hedge funds in 2026 is 15% to 25% of assets under management. When a fund's equity falls by this percentage from its high-water mark, the fund manager is typically required to reduce exposure significantly, report to investors, and in many cases pause trading until the cause of the drawdown is identified and remedied. Some funds have automatic rules that reduce position size to 50% of normal when drawdown reaches 10% and to zero (full stop of trading) when drawdown reaches 20%.
The high-water mark concept is central to professional fund management. A high-water mark is the highest peak equity value a fund has ever achieved. Performance fees are typically only charged on profits that exceed this high-water mark, meaning the fund manager must recover all previous losses before earning performance compensation. This structure creates a direct financial incentive for fund managers to minimize drawdowns aggressively.
Retail traders can and should apply similar principles to their own accounts. A practical retail trader drawdown rule structure for 2026 is as follows. At 5% drawdown from account peak, conduct a review of recent trades for rule violations. At 10% drawdown, reduce position size to 50% of normal until drawdown is recovered. At 15% drawdown, stop trading entirely for a minimum of one week, review the full trading journal for systematic errors, and only resume at 25% of normal position size. At 20% drawdown, stop trading for a minimum of one month and consider demo trading the strategy for 60 days before resuming live trading.
These rules feel restrictive in practice, particularly when the emotional response to a drawdown is to trade more aggressively to recover losses faster. But the mathematical and psychological evidence consistently shows that increasing activity and position size during drawdowns deepens them further rather than resolving them.
How to Build a Drawdown Recovery Plan for Your Trading Account
A drawdown recovery plan is a written document created before a drawdown occurs that specifies exactly how you will respond at each stage of an account decline. Creating it in advance, when thinking is clear and emotions are not involved, is what makes it actionable when the situation arises.
Stage 1: Detection (0% to 5% drawdown) At this stage, no action is required beyond awareness. Review the last five to ten trades to determine whether losses are resulting from normal strategy variance or from identifiable errors in execution or rule following. If errors are found, correct them before proceeding. If performance is within normal statistical variance for the strategy, continue trading at normal position size.
Stage 2: Alert (5% to 10% drawdown) Reduce position size to 75% of normal. Add a pre-trade checklist review before every trade to ensure full criteria compliance. Conduct a 30-minute end-of-day review comparing each trade's outcome against the system rules. If three consecutive losing days occur at this stage, move to Stage 3 immediately rather than waiting for the 10% level to be reached.
Stage 3: Protection (10% to 15% drawdown) Reduce position size to 50% of normal. Limit daily trades to a maximum of two. Stop trading immediately if the daily loss limit of 2% is reached. Conduct a full review of the trading journal from the current drawdown period, looking for patterns in losing trades: wrong time of day, wrong session, specific pair consistently losing, deviation from signal criteria.
Stage 4: Pause and Rebuild (beyond 15% drawdown) Stop all live trading. Spend a minimum of one week reviewing the strategy on historical data and current market conditions through demo or paper trading. Determine whether the drawdown is a result of a strategy failure (the market has changed and the edge no longer exists) or a behavioral failure (execution errors, emotional trading, rule violations). Resume live trading only with 25% of normal position size and only after at least 20 consecutive demo trades that meet full system criteria are profitable.
Writing this plan and keeping a printed copy next to your trading station converts it from an abstract concept into an operational protocol. The goal is not to prevent all drawdowns (which is impossible) but to prevent drawdowns from exceeding the level at which mathematical recovery becomes practically impossible.
Key Takeaways on Trading Drawdown in 2026
Drawdown is the most important risk metric in trading, measuring the peak-to-trough decline in account equity during a losing period. Maximum drawdown reveals the historical worst case, while average drawdown reveals typical losing sequence severity. The mathematics of recovery require that drawdowns be kept below 20% to remain in the practically recoverable range. Professional hedge funds use systematic drawdown limits with automatic position reduction rules. Every retail trader needs a written drawdown recovery plan with specific actions defined for each stage of account decline. Creating and following this plan before a drawdown occurs is what separates traders who survive long losing periods and go on to succeed from those who blow their accounts and exit trading permanently.
Financial Disclaimer: This content is for educational purposes only and does not constitute financial advice. All trading involves risk of loss. The examples and calculations provided are illustrative only. Please consult a qualified financial professional before making any trading decisions.